## Network Diagram: Interconnected System Architecture
### Overview
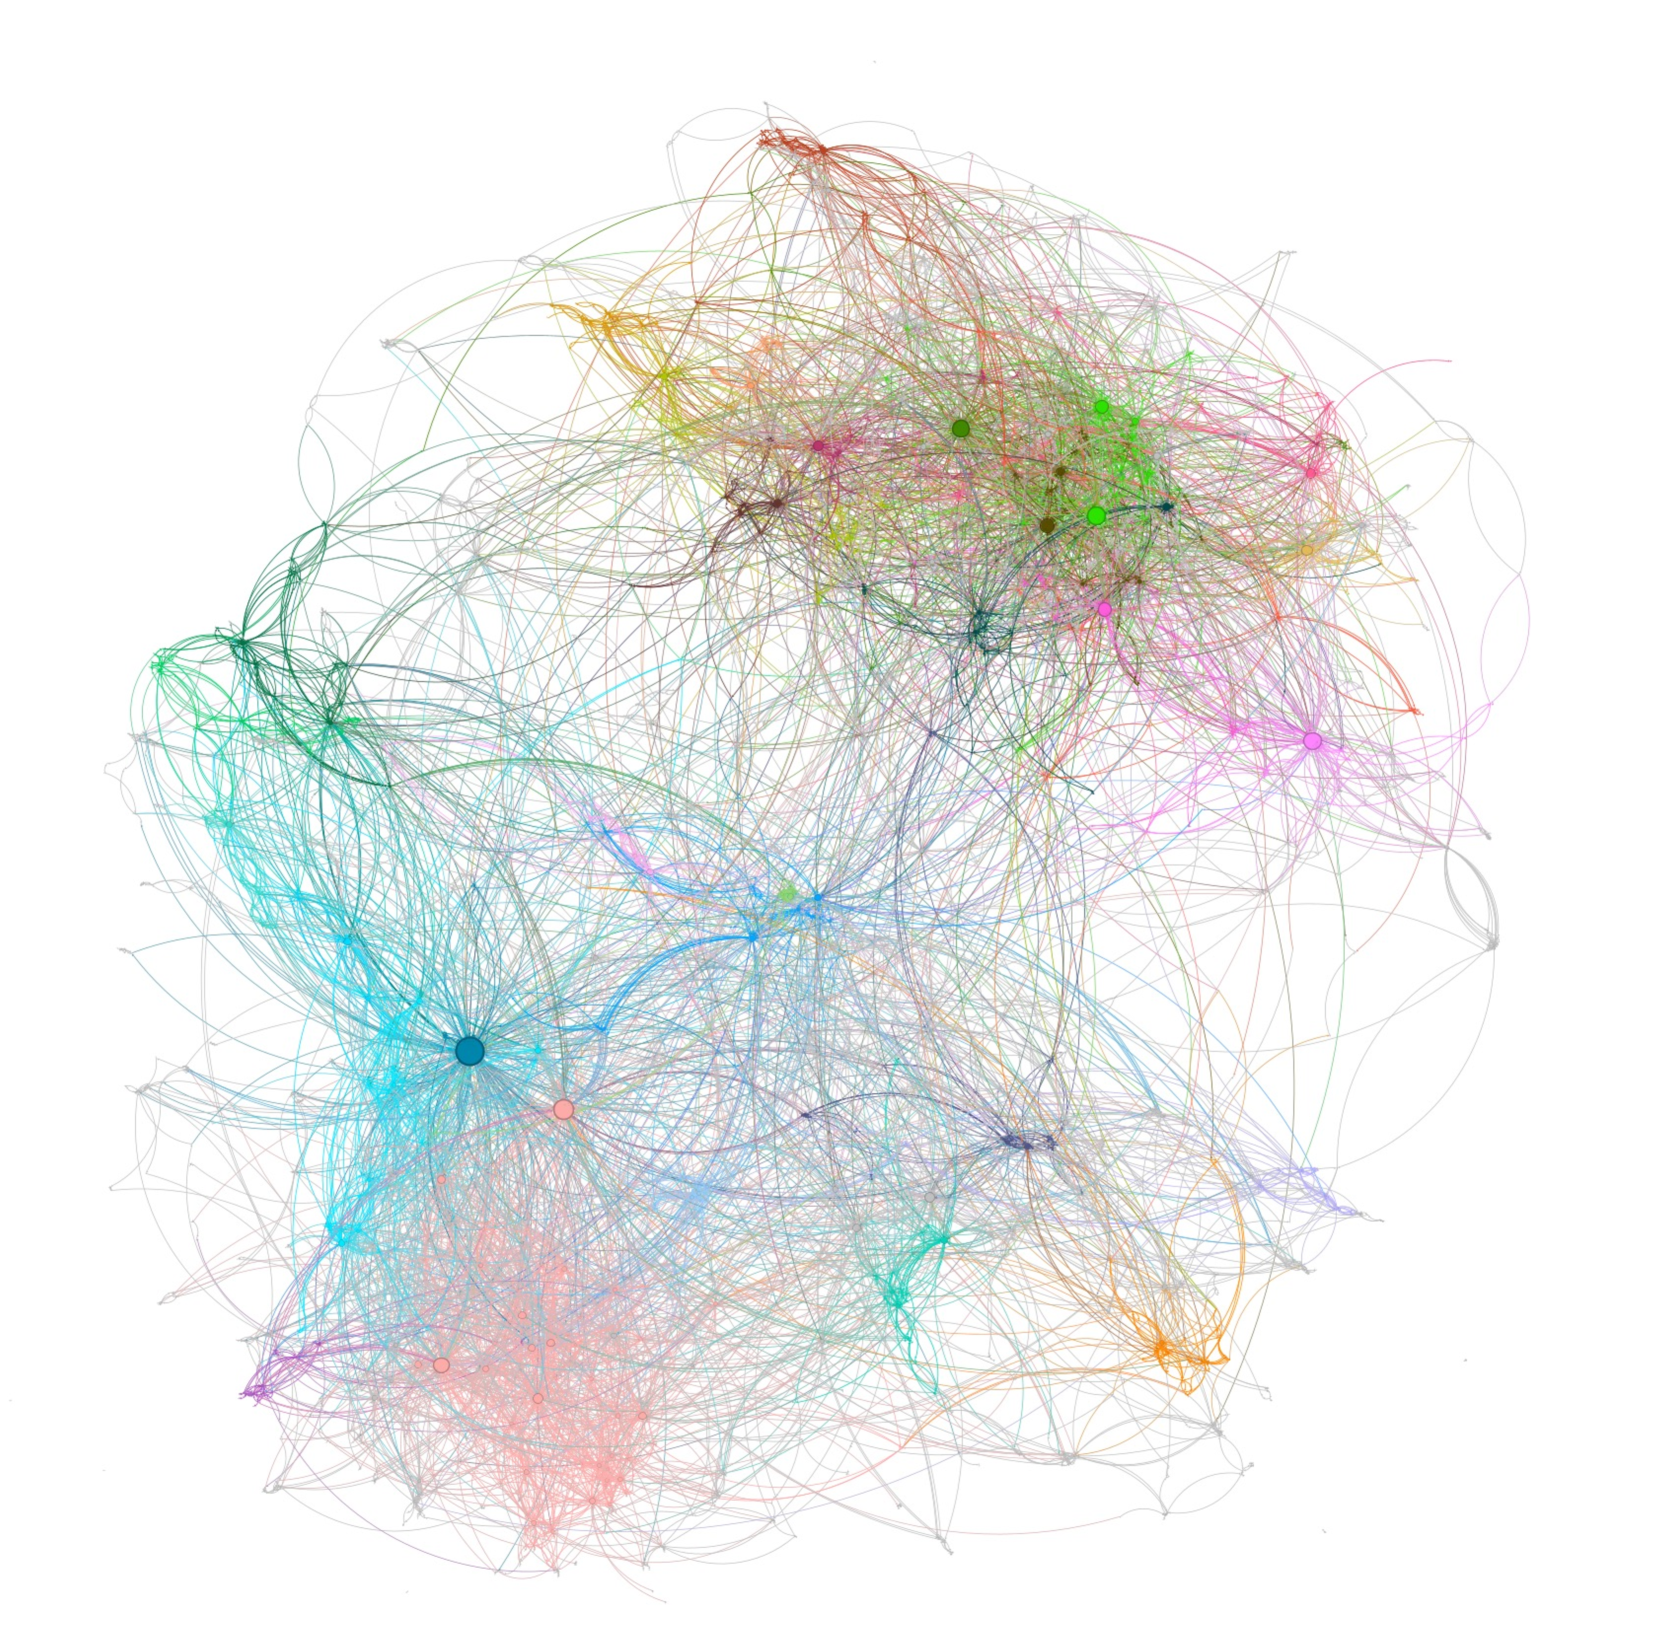
The image depicts a complex, undirected network of interconnected nodes and edges. Nodes are represented as colored circles of varying sizes, while edges are thin, crisscrossing lines. The network is densely packed, with no clear hierarchical structure or directional flow. Colors appear to cluster regionally, suggesting potential groupings or communities.
### Components/Axes
- **Nodes**:
- Colors: Blue, green, red, orange, pink, purple, gray.
- Sizes: Vary significantly (e.g., large blue node at bottom-left, small gray nodes scattered throughout).
- Positioning:
- Top-right cluster: Dominated by green and pink nodes.
- Bottom-left cluster: Blue and orange nodes.
- Central region: Mixed colors with high edge density.
- **Edges**:
- Thin, unidirectional lines (no arrows).
- Overlapping and tangled, indicating high connectivity.
- **Legend**: Absent. Color meanings inferred from spatial clustering.
### Detailed Analysis
- **Color Distribution**:
- Blue nodes (bottom-left) and green nodes (top-right) form distinct clusters.
- Red and orange nodes are sparse, appearing as outliers.
- Pink and purple nodes are interspersed across the network.
- **Node Sizes**:
- Largest node: Blue, bottom-left (potential hub).
- Smallest nodes: Gray, scattered peripherally.
- **Edge Density**:
- Central region has the highest edge concentration, suggesting a core module.
- Peripheral nodes (e.g., top-right green cluster) have fewer connections.
### Key Observations
1. **Modular Structure**: Color clustering implies potential communities (e.g., blue/orange vs. green/pink).
2. **Hub Nodes**: Large blue node (bottom-left) and green node (top-right) may act as central connectors.
3. **Edge Overlap**: High density in the center suggests critical interdependencies.
4. **Outliers**: Red and orange nodes are isolated, possibly representing edge cases or specialized components.
### Interpretation
The network likely represents a system with decentralized, modular components. The absence of a legend limits definitive categorization, but color clustering suggests functional or categorical groupings. The large blue and green nodes may serve as critical hubs, while the dense central connections imply a core module with high interaction. Outliers (red/orange) could indicate specialized or underconnected elements. The lack of directional edges suggests bidirectional relationships, common in social or peer-to-peer networks.
**Note**: Without explicit labels or legends, interpretations rely on visual patterns and common network analysis conventions (e.g., node size = importance, color = category).