# Technical Document Extraction: Graph Analysis
## 1. **Chart Overview**
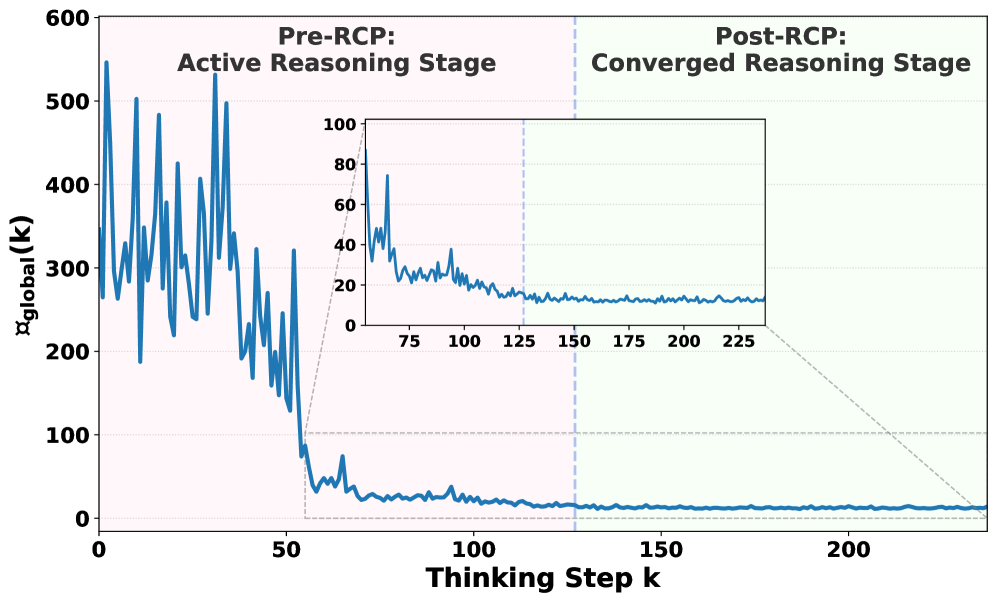
- **Title**: Not explicitly labeled, but contextually divided into two stages:
- **Pre-RCP: Active Reasoning Stage** (pink shaded region)
- **Post-RCP: Converged Reasoning Stage** (green shaded region)
- **Axes**:
- **X-axis**: "Thinking Step k" (ranges from 0 to 250)
- **Y-axis**: "Σglobal(k)" (ranges from 0 to 600)
- **Legend**: Located in the top-right corner (color: blue for the data line).
## 2. **Key Components**
### 2.1 **Main Chart**
- **Data Line**:
- **Color**: Blue
- **Behavior**:
- **Pre-RCP Stage (0–150 steps)**: Highly volatile, with sharp peaks and troughs (e.g., spikes up to ~550, drops to ~50).
- **Post-RCP Stage (150–250 steps)**: Stabilizes near ~20, with minimal fluctuations.
- **Trend Verification**:
- Initial phase (0–50 steps): Rapid oscillations.
- Transition (50–100 steps): Gradual decline.
- Post-150 steps: Convergence to a steady value (~20).
### 2.2 **Inset (Zoomed-In View)**
- **Region**: Focuses on steps 75–225.
- **Y-axis**: "Σglobal(k)" (0–100).
- **Behavior**:
- Sharp decline from ~80 (step 75) to ~20 (step 150).
- Post-150 steps: Stabilizes near ~20.
## 3. **Spatial Grounding**
- **Legend Placement**: Top-right corner (color: blue).
- **Shaded Regions**:
- **Pre-RCP**: Pink (0–150 steps).
- **Post-RCP**: Green (150–250 steps).
- **Dashed Vertical Line**: At step 150, demarcating the two stages.
## 4. **Trend Analysis**
- **Pre-RCP Stage**:
- **Initial Phase (0–50 steps)**: High-frequency oscillations (e.g., peaks at ~550, troughs at ~50).
- **Transition Phase (50–100 steps)**: Gradual reduction in amplitude.
- **Post-RCP Stage**:
- **Convergence (150–250 steps)**: Line flattens near ~20, indicating stabilized reasoning.
## 5. **Textual Elements**
- **Headers**:
- "Pre-RCP: Active Reasoning Stage" (pink region).
- "Post-RCP: Converged Reasoning Stage" (green region).
- **Axis Labels**:
- X-axis: "Thinking Step k".
- Y-axis: "Σglobal(k)".
- **Legend**: Blue line corresponds to the data series.
## 6. **Data Table Reconstruction**
| Stage | Steps (k) | Σglobal(k) Range | Behavior |
|---------------------|-----------|------------------|-------------------------|
| Pre-RCP | 0–150 | 50–550 | Highly volatile |
| Post-RCP | 150–250 | ~20 | Stable |
| Inset Focus | 75–225 | 0–100 | Sharp decline to ~20 |
## 7. **Color Consistency Check**
- **Legend**: Blue matches the data line in both main chart and inset.
- **Shaded Regions**: Pink (Pre-RCP) and green (Post-RCP) align with stage labels.
## 8. **Conclusion**
The graph illustrates a two-stage reasoning process:
1. **Active Reasoning (Pre-RCP)**: Characterized by high variability in global reasoning metrics.
2. **Converged Reasoning (Post-RCP)**: Metrics stabilize after RCP intervention, indicating reduced uncertainty or error.
**Note**: No additional languages or data tables are present. All textual elements are in English.