## Line Chart: Accuracy Comparison Across Iterations
### Overview
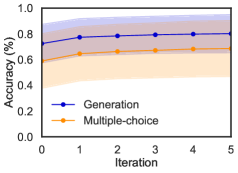
The image is a line chart comparing the accuracy of two methods ("Generation" and "Multiple-choice") over five iterations. Accuracy is measured on the y-axis (0% to 100%), and iterations are labeled on the x-axis (0 to 5). The chart includes shaded confidence intervals around each line, indicating variability in measurements.
### Components/Axes
- **Y-axis**: "Accuracy (%)" with ticks at 0.0, 0.2, 0.4, 0.6, 0.8, and 1.0.
- **X-axis**: "Iteration" with ticks at 0, 1, 2, 3, 4, and 5.
- **Legend**: Located at the bottom-left corner. Blue dots represent "Generation," and orange dots represent "Multiple-choice."
- **Shaded Areas**: Gray bands around each line indicate confidence intervals (e.g., ±1 standard deviation).
### Detailed Analysis
1. **Generation (Blue Line)**:
- **Trend**: Starts at ~0.75% accuracy at iteration 0, increases to ~0.85% by iteration 1, then plateaus between ~0.85% and ~0.87% for iterations 2–5.
- **Data Points**:
- Iteration 0: ~0.75%
- Iteration 1: ~0.85%
- Iterations 2–5: ~0.85–0.87%
- **Confidence Interval**: Narrower shaded band (~±0.05% range).
2. **Multiple-choice (Orange Line)**:
- **Trend**: Begins at ~0.60% accuracy at iteration 0, rises to ~0.65% by iteration 1, then stabilizes between ~0.65% and ~0.67% for iterations 2–5.
- **Data Points**:
- Iteration 0: ~0.60%
- Iteration 1: ~0.65%
- Iterations 2–5: ~0.65–0.67%
- **Confidence Interval**: Wider shaded band (~±0.10% range).
### Key Observations
- **Performance Gap**: "Generation" consistently outperforms "Multiple-choice" by ~0.20–0.25% across all iterations.
- **Plateau Effect**: Both methods show minimal improvement after iteration 1, suggesting diminishing returns.
- **Confidence Variability**: "Multiple-choice" exhibits greater uncertainty (wider shaded area) compared to "Generation."
### Interpretation
The data suggests that the "Generation" method is more accurate and reliable than "Multiple-choice" for the measured task. The plateau in accuracy after iteration 1 implies that further iterations yield negligible improvements, highlighting potential inefficiencies in extended training or testing. The narrower confidence intervals for "Generation" reinforce its stability, while the wider intervals for "Multiple-choice" indicate higher variability in performance. This could reflect differences in algorithmic robustness or data handling between the two approaches.