\n
## Line Chart: Accuracy vs. Iteration
### Overview
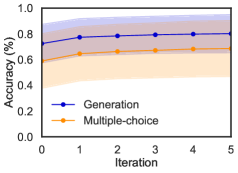
This image presents a line chart comparing the accuracy of two methods – "Generation" and "Multiple-choice" – across five iterations. The chart displays accuracy as a percentage on the y-axis and iteration number on the x-axis. Each line is accompanied by a shaded region, likely representing a confidence interval or standard deviation.
### Components/Axes
* **X-axis:** "Iteration" ranging from 0 to 5. Markers are present at each integer value.
* **Y-axis:** "Accuracy (%)" ranging from 0.0 to 1.0. Markers are present at 0.2 intervals.
* **Data Series 1:** "Generation" represented by a dark blue line with circular markers.
* **Data Series 2:** "Multiple-choice" represented by an orange line with circular markers.
* **Legend:** Located in the bottom-center of the chart, identifying the lines by their respective names ("Generation" and "Multiple-choice").
* **Shaded Regions:** A light blue shaded region surrounds the "Generation" line, and a light orange shaded region surrounds the "Multiple-choice" line.
### Detailed Analysis
**Generation (Dark Blue Line):**
The "Generation" line exhibits a slight upward trend initially, then plateaus.
* Iteration 0: Approximately 0.79 accuracy.
* Iteration 1: Approximately 0.81 accuracy.
* Iteration 2: Approximately 0.80 accuracy.
* Iteration 3: Approximately 0.80 accuracy.
* Iteration 4: Approximately 0.80 accuracy.
* Iteration 5: Approximately 0.80 accuracy.
**Multiple-choice (Orange Line):**
The "Multiple-choice" line shows a similar initial increase, followed by a plateau.
* Iteration 0: Approximately 0.64 accuracy.
* Iteration 1: Approximately 0.67 accuracy.
* Iteration 2: Approximately 0.67 accuracy.
* Iteration 3: Approximately 0.67 accuracy.
* Iteration 4: Approximately 0.67 accuracy.
* Iteration 5: Approximately 0.67 accuracy.
The shaded regions indicate variability in the accuracy measurements. The light blue region around "Generation" is relatively narrow, suggesting more consistent results. The light orange region around "Multiple-choice" is also relatively narrow, suggesting consistent results.
### Key Observations
* "Generation" consistently outperforms "Multiple-choice" across all iterations.
* Both methods appear to converge in accuracy after the first iteration, with minimal improvement observed beyond that point.
* The accuracy of "Generation" remains relatively stable around 0.80, while the accuracy of "Multiple-choice" remains relatively stable around 0.67.
### Interpretation
The data suggests that the "Generation" method is more accurate than the "Multiple-choice" method for the task being evaluated. However, both methods exhibit diminishing returns after the first iteration, indicating that further iterations may not significantly improve performance. The consistent accuracy levels and narrow confidence intervals (represented by the shaded regions) suggest that the results are reliable and not due to random chance. The plateauing effect could indicate that the methods have reached their performance limits, or that the task itself has inherent limitations. Further investigation might involve exploring different methods or modifying the task to overcome these limitations. The chart demonstrates a clear performance difference between the two methods, with "Generation" being the superior approach in this context.