## Line Chart: Model Accuracy Over Iterations
### Overview
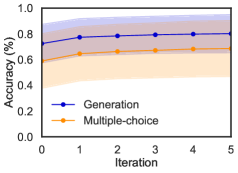
The image displays a line chart comparing the accuracy performance of two different methods, labeled "Generation" and "Multiple-choice," across a series of training or evaluation iterations. The chart includes shaded regions representing confidence intervals or standard deviation around each mean accuracy line.
### Components/Axes
* **Chart Type:** Line chart with shaded confidence bands.
* **X-Axis:**
* **Label:** "Iteration"
* **Scale:** Linear, from 0 to 5, with major tick marks at each integer (0, 1, 2, 3, 4, 5).
* **Y-Axis:**
* **Label:** "Accuracy (%)"
* **Scale:** Linear, from 0.0 to 1.0, with major tick marks at 0.0, 0.2, 0.4, 0.6, 0.8, and 1.0.
* **Legend:**
* **Position:** Bottom-center of the chart area.
* **Series 1:** "Generation" - Represented by a blue line with circular markers.
* **Series 2:** "Multiple-choice" - Represented by an orange line with circular markers.
* **Data Series & Confidence Intervals:**
* Each line is accompanied by a semi-transparent shaded band of the corresponding color (blue for Generation, orange for Multiple-choice), indicating the range of uncertainty or variance around the mean accuracy at each iteration.
### Detailed Analysis
**Trend Verification & Data Points (Approximate):**
1. **Generation (Blue Line):**
* **Trend:** The line shows a sharp initial increase from iteration 0 to 1, followed by a more gradual rise that plateaus from iteration 2 onward.
* **Data Points (Mean Accuracy):**
* Iteration 0: ~0.75
* Iteration 1: ~0.80
* Iteration 2: ~0.82
* Iteration 3: ~0.82
* Iteration 4: ~0.82
* Iteration 5: ~0.82
* **Confidence Interval:** The blue shaded band is widest at iteration 0 (spanning roughly 0.65 to 0.85) and narrows slightly as iterations progress, indicating decreasing variance.
2. **Multiple-choice (Orange Line):**
* **Trend:** The line shows a steady, moderate increase from iteration 0 to 2, after which it plateaus.
* **Data Points (Mean Accuracy):**
* Iteration 0: ~0.60
* Iteration 1: ~0.65
* Iteration 2: ~0.68
* Iteration 3: ~0.68
* Iteration 4: ~0.68
* Iteration 5: ~0.68
* **Confidence Interval:** The orange shaded band is also widest at the start (spanning roughly 0.45 to 0.75 at iteration 0) and narrows over time, though it remains wider than the Generation band at corresponding iterations.
### Key Observations
* **Performance Gap:** The "Generation" method consistently achieves higher accuracy than the "Multiple-choice" method at every measured iteration. The gap is approximately 0.15 (15 percentage points) at iteration 0 and narrows slightly to about 0.14 by the plateau.
* **Convergence:** Both methods appear to converge to a stable accuracy level by iteration 2 or 3, with minimal improvement thereafter.
* **Variance:** Both methods show higher variance (wider confidence intervals) in early iterations, which decreases as training progresses. The "Multiple-choice" method exhibits greater variance than "Generation" at all points.
* **Initial Learning Rate:** "Generation" shows a steeper initial learning curve (larger gain from iter 0 to 1) compared to the more gradual initial ascent of "Multiple-choice."
### Interpretation
The data suggests that the "Generation" approach is both more effective (higher final accuracy) and more efficient (reaches near-peak performance faster) than the "Multiple-choice" approach for the given task. The plateau indicates that further iterations beyond 2 or 3 yield diminishing returns for both methods under the current conditions.
The consistently wider confidence interval for "Multiple-choice" implies its performance is less stable or more sensitive to initial conditions or data variations compared to "Generation." The narrowing of both intervals over time is a typical sign of model stabilization during training.
From a Peircean perspective, the chart is an *icon* representing the relationship between training time (iteration) and performance (accuracy). It is also an *index* pointing to the underlying cause: the "Generation" method's architecture or training procedure is fundamentally better suited to this task than the "Multiple-choice" method. The *interpretant* for a viewer is the conclusion that "Generation" is the superior method, warranting its selection for deployment or further development. The notable outlier is the high initial variance, which might prompt an investigation into the stability of the early training phases.