## Line Chart: FVU by Layer and Location
### Overview
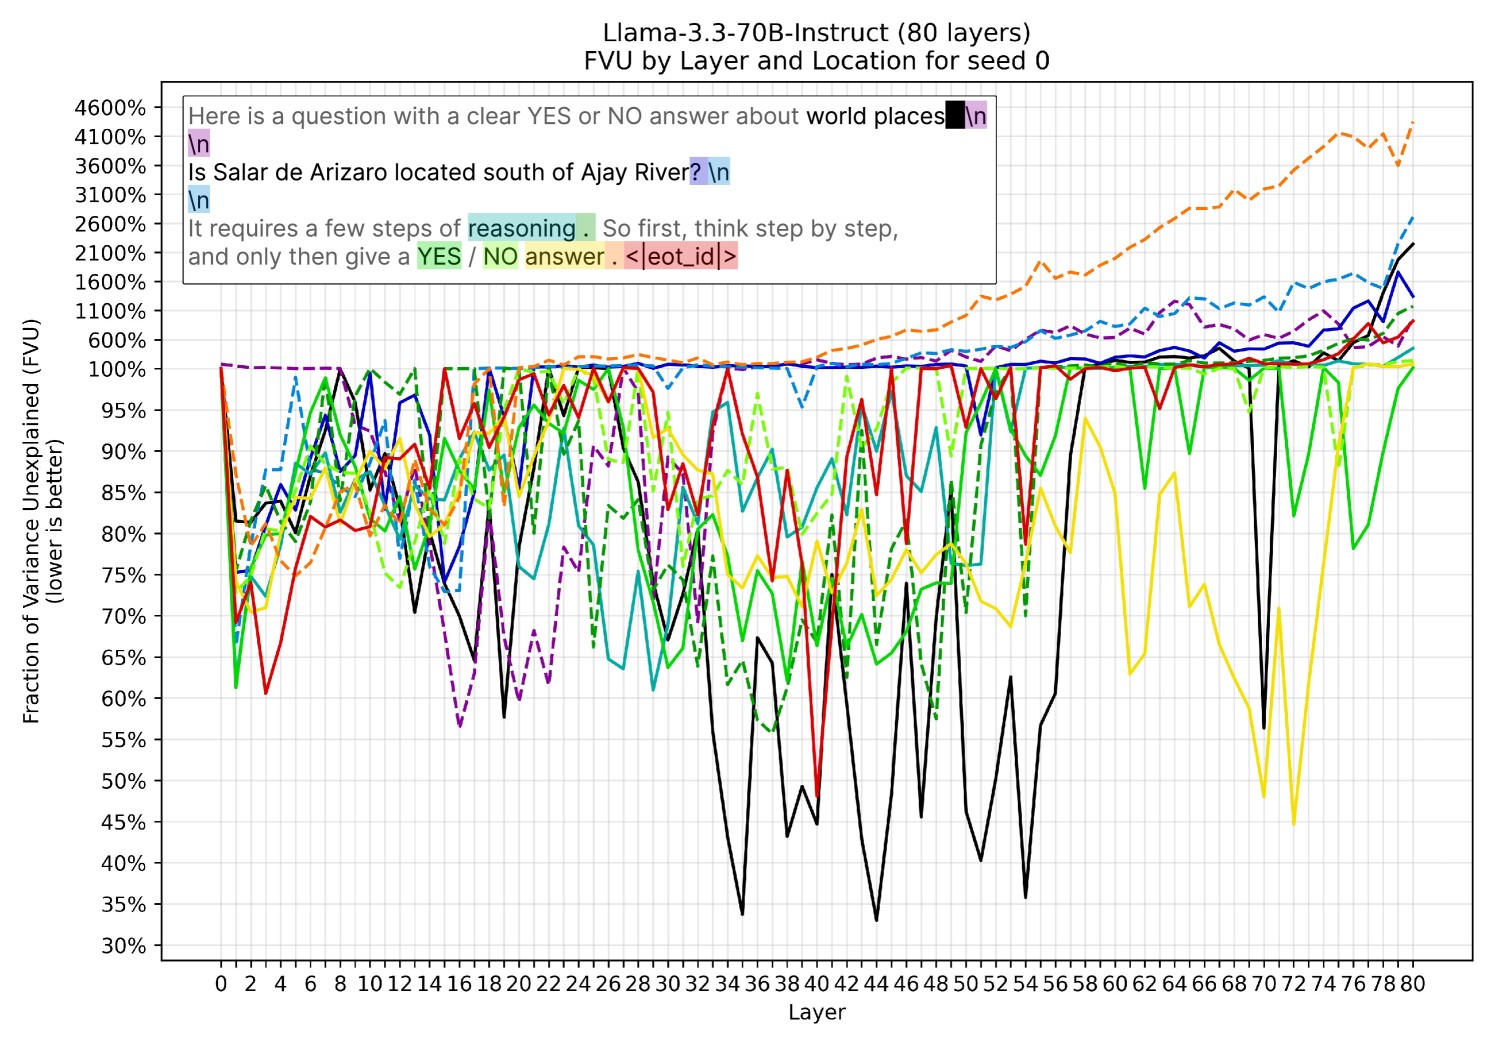
The image is a line chart displaying the Fraction of Variance Unexplained (FVU) across different layers of the Llama-3.3-70B-Instruct model. The x-axis represents the layer number (0 to 80), and the y-axis represents the FVU, ranging from 30% to 4600%. Different colored lines represent different locations or prompts. The chart aims to show how FVU changes across layers for various input conditions.
### Components/Axes
* **Title:** Llama-3.3-70B-Instruct (80 layers) FVU by Layer and Location for seed 0
* **X-axis:** Layer (numerical scale from 0 to 80, incrementing by 2)
* **Y-axis:** Fraction of Variance Unexplained (FVU) (lower is better) (percentage scale from 30% to 4600%, with major ticks at 30%, 35%, 40%, 45%, 50%, 55%, 60%, 65%, 70%, 75%, 80%, 85%, 90%, 95%, 100%, 600%, 1100%, 1600%, 2100%, 2600%, 3100%, 3600%, 4100%, 4600%)
* **Textual Prompts:**
* "Here is a question with a clear YES or NO answer about world places \n"
* "Is Salar de Arizaro located south of Ajay River? \n"
* "\n It requires a few steps of reasoning. So first, think step by step, and only then give a YES / NO answer . <|eot_id|>"
### Detailed Analysis
The chart contains multiple data series, each represented by a different colored line. The lines generally start with high variance at the initial layers and then converge or stabilize as the layer number increases. Some lines show a significant increase in FVU towards the later layers.
Here's a breakdown of the trends for some of the visible lines:
* **Orange (dashed) Line:** Starts around 75% FVU and generally increases with layer number, showing a significant upward trend after layer 60, reaching approximately 4000% at layer 80.
* **Dark Blue Line:** Starts around 85% FVU, remains relatively stable around 100% until layer 60, then increases to approximately 1600% at layer 80.
* **Teal Line:** Starts around 80% FVU, remains relatively stable around 100% until layer 60, then increases to approximately 1800% at layer 80.
* **Purple (dashed) Line:** Starts at 100% FVU, fluctuates significantly between 55% and 100% until layer 60, then increases to approximately 1600% at layer 80.
* **Green Line:** Starts around 85% FVU, fluctuates significantly between 60% and 100% until layer 60, then remains relatively stable around 100% at layer 80.
* **Black Line:** Starts around 100% FVU, fluctuates significantly between 35% and 100% until layer 60, then remains relatively stable around 100% at layer 80.
* **Yellow Line:** Starts around 80% FVU, fluctuates significantly between 40% and 100% until layer 60, then remains relatively stable around 100% at layer 80.
* **Red Line:** Starts around 60% FVU, fluctuates significantly between 55% and 100% until layer 60, then remains relatively stable around 100% at layer 80.
### Key Observations
* The orange dashed line exhibits the most significant increase in FVU towards the later layers.
* Several lines converge around the 100% FVU mark after layer 60.
* The initial layers (0-20) show high variability in FVU across different locations.
* The "reasoning" prompt (green text) seems to have a lower FVU compared to the other prompts in the initial layers.
### Interpretation
The chart illustrates how the fraction of variance unexplained changes across different layers of the Llama-3.3-70B-Instruct model for various input prompts. The initial layers show high variability, suggesting that these layers are more sensitive to the specific input. As the layer number increases, the FVU tends to converge for most prompts, indicating that the later layers are learning more general features. The orange dashed line, which corresponds to a specific location or prompt, shows a significant increase in FVU towards the later layers, suggesting that the model struggles to explain the variance for this particular input as it goes deeper into the network. This could indicate that the model is overfitting to the training data or that the input is inherently more complex. The "reasoning" prompt (green text) having a lower FVU in the initial layers might suggest that the model is better at capturing the variance for this type of input early on.