\n
## Line Chart: FVU by Layer and Location for seed 0
### Overview
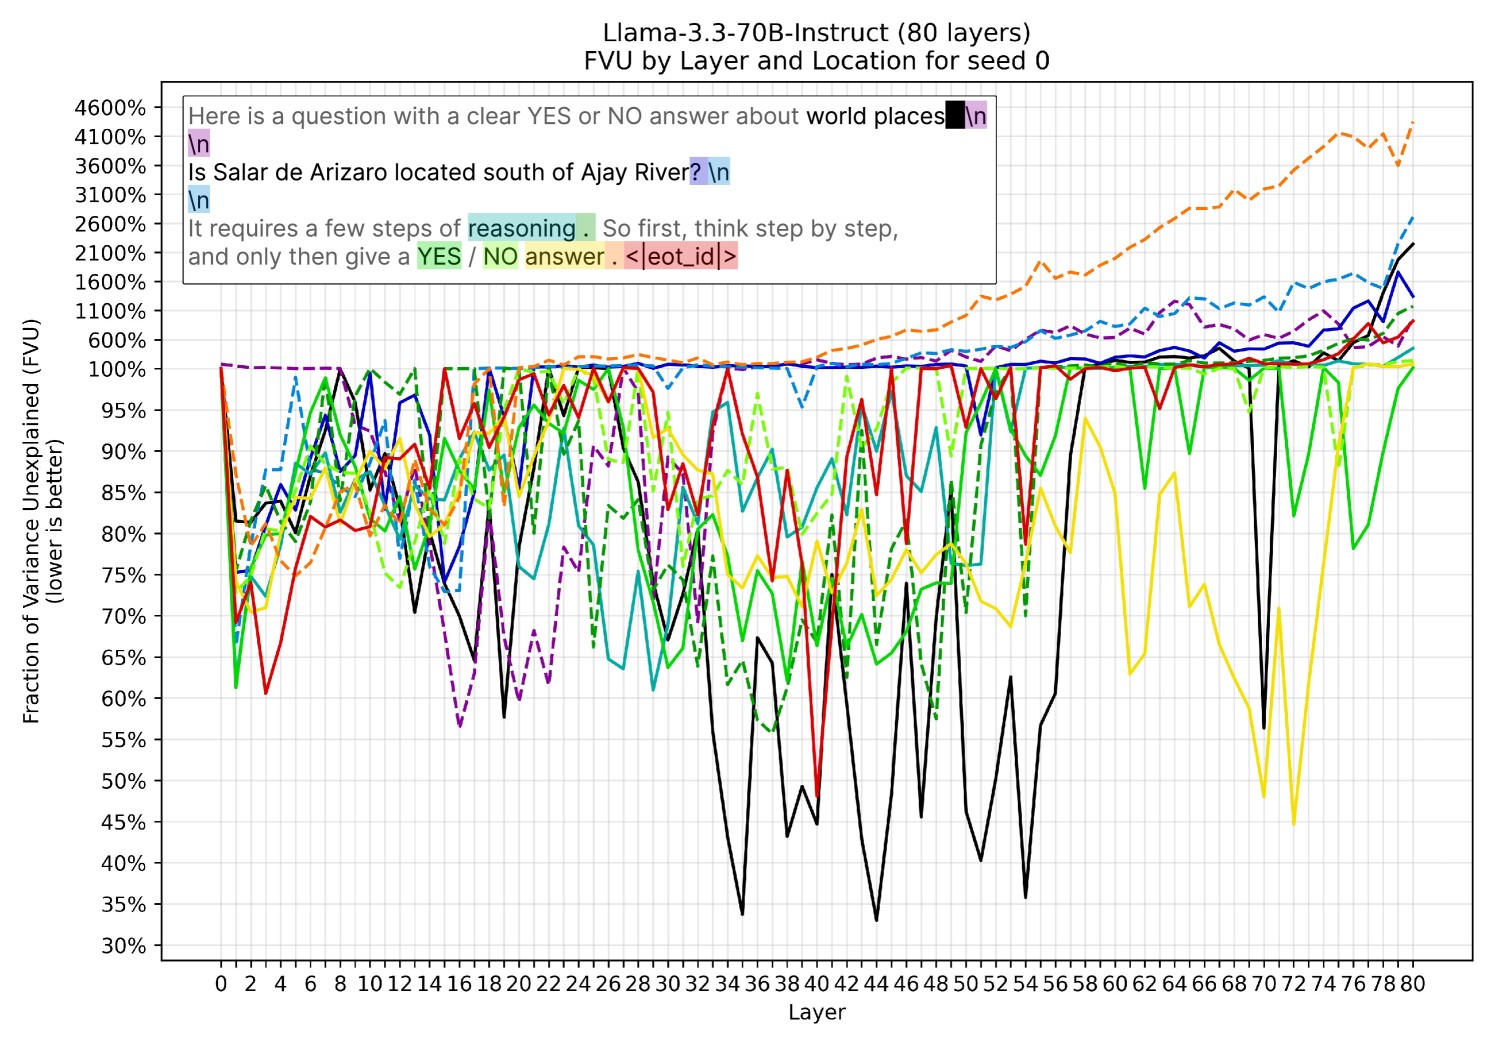
This image presents a line chart visualizing the Fraction of Variance Unexplained (FVU) across different layers (0 to 80) for a model named "Llama-3.3-70B-Instruct (80 layers)". The chart also includes a text block containing a question and instructions, seemingly related to reasoning about geographical locations.
### Components/Axes
* **X-axis:** Layer, ranging from 0 to 80, with increments of 2. Label: "Layer"
* **Y-axis:** Fraction of Variance Unexplained (FVU), ranging from 30% to 4600%, with increments of approximately 350%. Label: "Fraction of Variance Unexplained (FVU) (lower is better)"
* **Lines:** Multiple lines representing different locations. A legend is present, but the exact location names are difficult to discern due to the image quality. There are approximately 20 lines visible.
* **Text Block:** Located in the top-left corner of the chart.
### Detailed Analysis
The chart displays FVU values for each layer across multiple locations. The lines exhibit varying trends, with some generally decreasing (indicating better performance) and others fluctuating.
Here's a breakdown of the approximate FVU values for a few key layers, based on color matching with the legend (note: due to image quality, these are estimates):
* **Layer 0:**
* Dark Blue: ~380%
* Light Blue: ~360%
* Green: ~400%
* Red: ~420%
* Yellow: ~440%
* **Layer 8:**
* Dark Blue: ~340%
* Light Blue: ~320%
* Green: ~360%
* Red: ~380%
* Yellow: ~400%
* **Layer 16:**
* Dark Blue: ~320%
* Light Blue: ~300%
* Green: ~340%
* Red: ~360%
* Yellow: ~380%
* **Layer 24:**
* Dark Blue: ~300%
* Light Blue: ~280%
* Green: ~320%
* Red: ~340%
* Yellow: ~360%
* **Layer 32:**
* Dark Blue: ~320%
* Light Blue: ~300%
* Green: ~340%
* Red: ~360%
* Yellow: ~380%
* **Layer 40:**
* Dark Blue: ~340%
* Light Blue: ~320%
* Green: ~360%
* Red: ~380%
* Yellow: ~400%
* **Layer 48:**
* Dark Blue: ~360%
* Light Blue: ~340%
* Green: ~380%
* Red: ~400%
* Yellow: ~420%
* **Layer 56:**
* Dark Blue: ~380%
* Light Blue: ~360%
* Green: ~400%
* Red: ~420%
* Yellow: ~440%
* **Layer 64:**
* Dark Blue: ~400%
* Light Blue: ~380%
* Green: ~420%
* Red: ~440%
* Yellow: ~460%
* **Layer 72:**
* Dark Blue: ~420%
* Light Blue: ~400%
* Green: ~440%
* Red: ~460%
* Yellow: ~400%
* **Layer 80:**
* Dark Blue: ~440%
* Light Blue: ~420%
* Green: ~460%
* Red: ~400%
* Yellow: ~380%
**Text Block Transcription:**
```
Here is a question with a clear YES or NO answer about world places
Is Salar de Arizaro located south of Ajay River?
It requires a few steps of reasoning. So first, think step by step,
and only then give a YES / NO answer. <|eot_id|>
```
### Key Observations
* The FVU generally decreases from layer 0 to around layer 16-24 for most locations, then begins to fluctuate or increase again.
* The yellow line consistently exhibits higher FVU values compared to other locations throughout most of the layers.
* The light blue line generally shows the lowest FVU values.
* There is significant variation in FVU values across different locations at each layer.
* The text block suggests the chart is part of a larger experiment involving reasoning and geographical knowledge.
### Interpretation
The chart likely represents the performance of a language model (Llama-3.3-70B-Instruct) as it processes information through different layers. The FVU metric indicates how much variance in the model's output remains unexplained, with lower values suggesting better performance. The fluctuations in FVU across layers could indicate the model is learning and refining its understanding of the data. The varying FVU values across locations suggest that the model's performance is sensitive to the specific geographical context.
The text block indicates that the model is being tested on its ability to answer questions requiring reasoning about geographical locations. The instruction to "think step by step" suggests that the model is being evaluated on its ability to perform multi-hop reasoning. The `<|eot_id|>` tag likely marks the end of the input sequence for the model.
The fact that FVU increases again after an initial decrease could indicate overfitting or a loss of generalization ability in later layers. The consistently high FVU for the yellow line suggests that this location is particularly challenging for the model to understand or represent.