TECHNICAL ASSET FINGERPRINT
b466ffd26b17d8f4b55feb49
Click to view fullscreen
Press ESC or click to close
FOUND IN PAPERS
EXPERT: healer-alpha-free VERSION 1
RUNTIME: free/openrouter/healer-alpha
INTEL_VERIFIED
## Line Chart: FVU by Layer and Location for Llama-3.3-70B-Instruct
### Overview
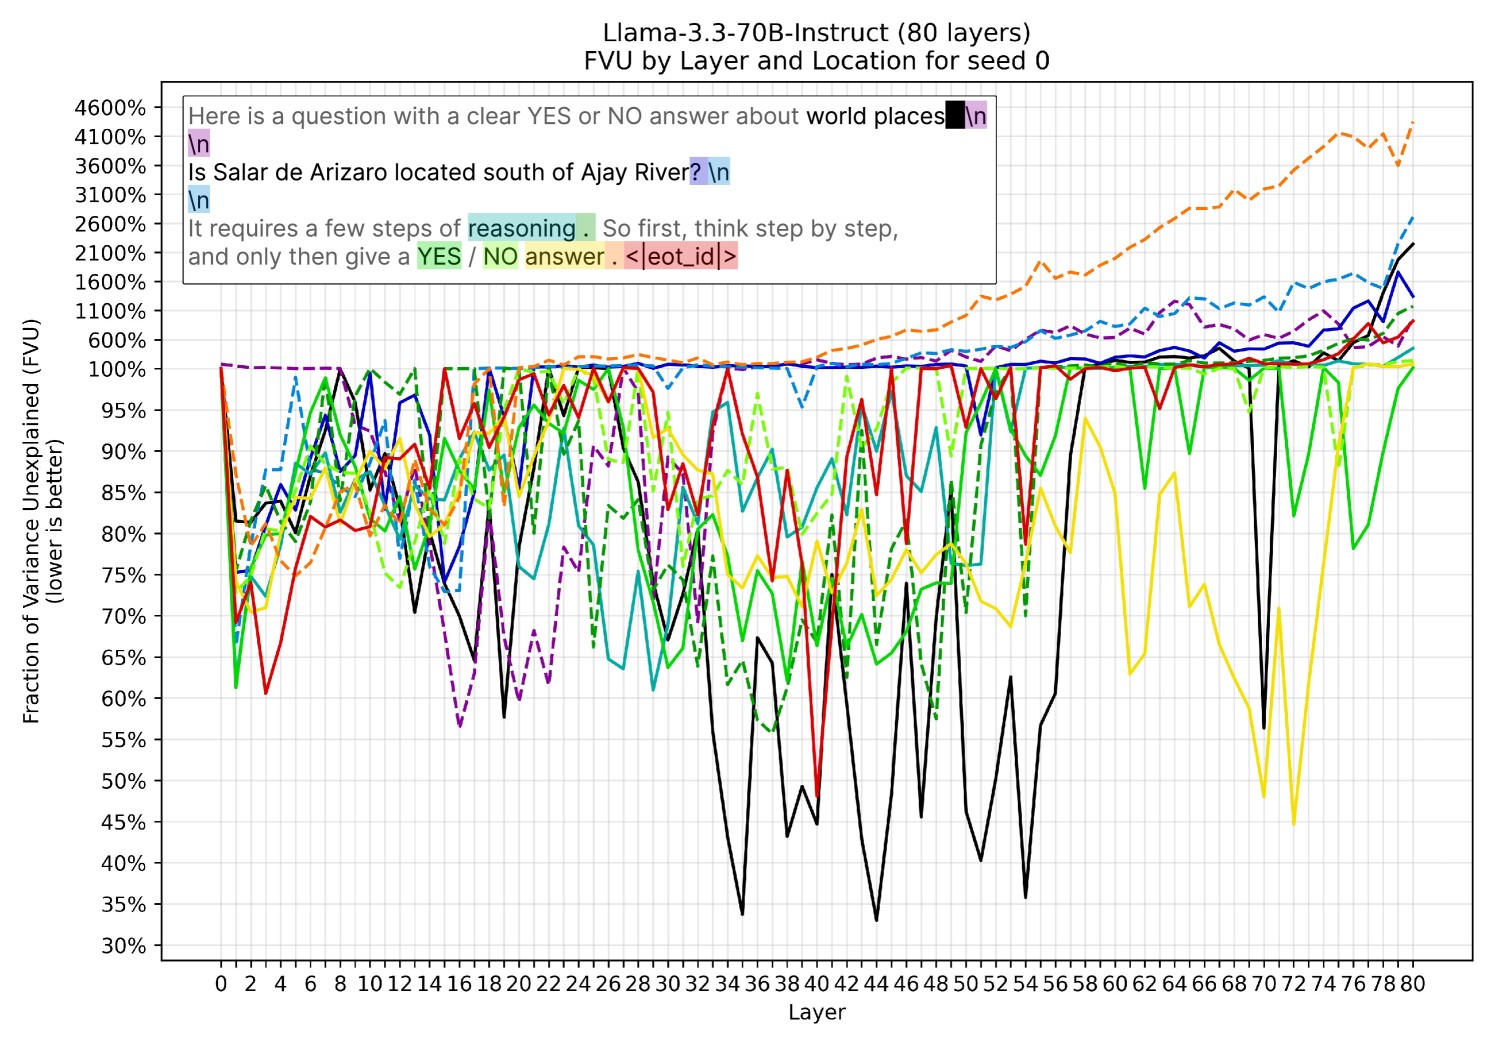
This is a line chart visualizing the "Fraction of Variance Unexplained (FVU)" across the 80 layers of the Llama-3.3-70B-Instruct model for a specific prompt (seed 0). The chart tracks how well different components of a prompt are "explained" or processed at each layer, with lower FVU indicating better explanation. A text box in the upper-left corner displays the specific prompt being analyzed.
### Components/Axes
* **Title:** "Llama-3.3-70B-Instruct (80 layers) / FVU by Layer and Location for seed 0"
* **Y-Axis:** "Fraction of Variance Unexplained (FVU) / (lower is better)". The scale is non-linear, with a major break. It runs from 30% to 100% in increments of 5%, then jumps to a logarithmic-like scale from 600% to 4600% in increments of 500%.
* **X-Axis:** "Layer", numbered from 0 to 80 in increments of 2.
* **Prompt Text Box (Top-Left):** Contains the analyzed prompt with color-coded highlights corresponding to the data series lines:
* `Here is a question with a clear YES or NO answer about ` **world places** `[black highlight]` `\n`
* `Is Salar de Arizaro located south of Ajay River?` `[blue highlight]` `\n`
* `\n`
* `It requires a few steps of ` **reasoning** `[green highlight]` `. So first, think step by step,`
* `and only then give a ` **YES / NO answer** `[orange highlight]` `. <|eot_id|>` `[pink highlight]`
* **Data Series (Lines):** Multiple colored lines, each corresponding to a highlighted segment in the prompt text box. The lines are a mix of solid and dashed styles.
### Detailed Analysis
The chart plots 7 distinct data series, identified by matching the highlight colors in the prompt text to the line colors in the chart. The legend is embedded within the prompt text box.
1. **Black Line (Solid):** Corresponds to "world places". This line shows extreme volatility, with FVU values plunging to as low as ~33% (Layer 44) and spiking above 100% in the later layers (e.g., ~110% at Layer 78). It demonstrates the most dramatic swings of any series.
2. **Blue Line (Solid):** Corresponds to "Salar de Arizaro located south of Ajay River?". This line remains relatively stable near 100% FVU for the first ~50 layers, then begins a steady upward trend, exceeding 1600% FVU by Layer 80.
3. **Green Line (Solid):** Corresponds to "reasoning". This line fluctuates significantly between ~60% and 100% FVU for most layers, with a notable dip to ~65% around Layer 48. It ends near 100% at Layer 80.
4. **Orange Line (Dashed):** Corresponds to "YES / NO answer". This line shows a consistent, steep upward trend. Starting near 100% at Layer 0, it climbs almost linearly, reaching the highest value on the chart at approximately 4400% FVU by Layer 80.
5. **Pink Line (Dashed):** Corresponds to the end-of-text token `<|eot_id|>`. This line follows a path very similar to the blue line, staying near 100% initially and then rising sharply after Layer 50, ending near 2600% FVU.
6. **Purple Line (Dashed):** (Color inferred from chart, not explicitly highlighted in text). This line shows high volatility in the early layers (dipping to ~57% at Layer 16) and a general upward trend in later layers, ending around 1100% FVU.
7. **Yellow Line (Solid):** (Color inferred from chart, not explicitly highlighted in text). This line is highly volatile, with deep troughs (e.g., ~45% at Layer 72) and peaks near 100%. It does not show the strong late-layer upward trend seen in the blue, pink, and orange lines.
**Spatial & Trend Verification:**
* The **orange dashed line** is the topmost line for the majority of the chart's right half, confirming its status as the series with the highest FVU.
* The **black solid line** is the most volatile, frequently crossing other lines and occupying the lowest points on the chart (e.g., Layers 34, 44, 54).
* The **blue solid** and **pink dashed** lines are closely intertwined, especially after Layer 50, both trending strongly upward.
* The **green solid** line remains in the lower-middle range of the chart (60%-100%) for its entire duration.
### Key Observations
1. **Divergent Late-Layer Behavior:** After approximately Layer 50, the data series split into two clear groups: those that skyrocket in FVU (Orange, Blue, Pink) and those that remain bounded below ~1100% (Black, Green, Purple, Yellow).
2. **The "Answer" is Least Explained:** The "YES / NO answer" component (Orange) has by far the highest and most rapidly increasing FVU, suggesting the model's final layers are least able to "explain" or account for the variance in this part of the output.
3. **High Volatility in Early/Mid Layers:** Components like "world places" (Black) and the unattributed Yellow line show extreme fluctuations in FVU between Layers 0-50, indicating unstable processing of these concepts in the model's earlier layers.
4. **Prompt Structure Correlates with FVU:** The components that form the core question ("world places", the specific question) and the instruction ("reasoning") generally maintain lower FVU than the final answer token and the end-of-text marker.
### Interpretation
This chart provides a diagnostic view of how a large language model processes a complex, multi-step prompt across its depth. The "Fraction of Variance Unexplained" metric likely measures how much of the model's internal activation variance at each layer is *not* attributable to predicting a specific part of the prompt/output.
* **What it suggests:** The model's processing is not uniform. Early layers handle foundational concepts ("world places") with high instability. Middle layers engage in "reasoning" (Green line, lower FVU). The most striking finding is that the final answer ("YES / NO") and the end-of-sequence token become progressively *less* explained by the model's internal states in the final layers. This could imply that the final answer is generated through a process that is highly distinct from the earlier reasoning steps, or that the model's representations become increasingly specialized and less generalizable in the final layers.
* **Relationships:** The close tracking of the blue (question) and pink (`<|eot_id|>`) lines suggests a strong coupling in how the model processes the end of the question and the signal to stop generating. The volatility of the black ("world places") line indicates this is a challenging or broadly distributed concept for the model to pin down internally.
* **Anomaly:** The sheer magnitude of the FVU for the answer component (over 4000%) is an outlier compared to all other components. This extreme value warrants investigation—it may be an artifact of the metric calculation or indicate a fundamental shift in the model's representational strategy for final output generation.
DECODING INTELLIGENCE...