## Line Graph: Llama-3-70B-Instruct (80 layers) FVU by Layer and Location for seed 0
### Overview
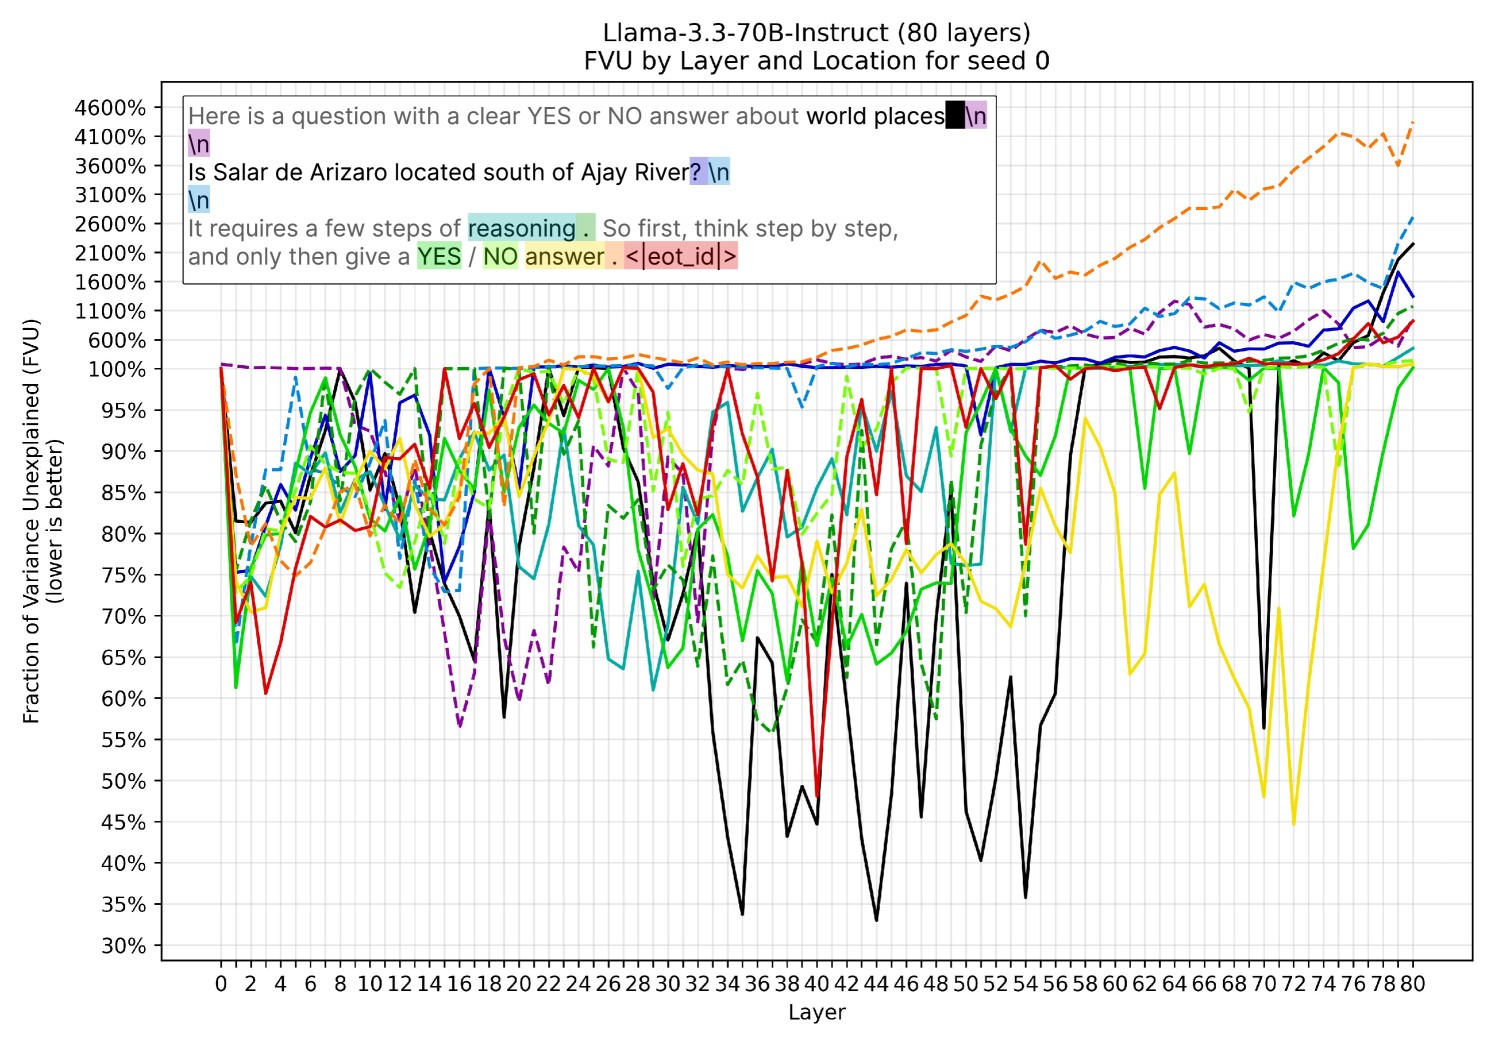
The image is a multi-line graph visualizing the **Fraction of Variance Unexplained (FVU)** across 80 layers of the Llama-3-70B-Instruct model. The y-axis ranges from 30% to 4600% (unusually high for FVU, which typically maxes at 100%), while the x-axis represents layers 0–80. Multiple colored lines (e.g., orange, black, green, red) correspond to different "locations" in the model, as indicated by the legend. A text box in the top-left corner contains a question about Salar de Arizaro and reasoning steps.
---
### Components/Axes
- **X-axis (Layer)**: Labeled "Layer" with ticks from 0 to 80.
- **Y-axis (FVU)**: Labeled "Fraction of Variance Unexplained (FVU)" with percentages from 30% to 4600%.
- **Legend**: Located in the top-left corner, mapping colors to "locations" (e.g., orange = "n", black = "eot_id", green = "yes", red = "no").
- **Text Box**: Contains the question:
*"Here is a question with a clear YES or NO answer about world places. Is Salar de Arizaro located south of Ajay River? It requires a few steps of reasoning. So first, think step by step, and only then give a YES / NO answer. <eot_id>"*
---
### Detailed Analysis
#### Key Trends:
1. **Orange Line ("n")**:
- Starts at ~100% FVU at layer 0.
- Peaks at **~4600% FVU** at layer 80 (anomaly, as FVU cannot exceed 100%).
- Shows erratic fluctuations, with sharp drops and rises.
2. **Black Line ("eot_id")**:
- Starts at ~100% FVU at layer 0.
- Decreases to ~30% FVU by layer 80.
- Exhibits significant volatility, with sharp dips (e.g., ~20% at layer 40).
3. **Green Line ("yes")**:
- Starts at ~100% FVU at layer 0.
- Fluctuates between ~70%–95% FVU, with a notable dip to ~60% at layer 30.
4. **Red Line ("no")**:
- Starts at ~100% FVU at layer 0.
- Drops to ~50% FVU by layer 80, with sharp declines (e.g., ~40% at layer 50).
5. **Other Lines**:
- Blue, purple, and yellow lines show similar patterns, with FVU values ranging from ~70%–100%.
#### Spatial Grounding:
- **Legend**: Top-left corner, with color-coded labels.
- **Text Box**: Overlays the top-left corner, partially obscuring the orange line.
- **Lines**: Distributed across the graph, with each color corresponding to a "location" (e.g., "n" = orange, "eot_id" = black).
---
### Key Observations
1. **Anomaly in Orange Line ("n")**:
- The FVU value of **4600%** at layer 80 is implausible for FVU, suggesting a data error, mislabeling, or misinterpretation of the metric.
2. **Convergence of Lines**:
- Most lines (e.g., black, green, red) show a general downward trend, indicating reduced FVU (improved model performance) in later layers.
3. **Volatility**:
- All lines exhibit significant fluctuations, suggesting instability in FVU across layers.
4. **Text Box Context**:
- The question about Salar de Arizaro implies the model is processing a geospatial reasoning task, with "eot_id" possibly marking the end of a token sequence.
---
### Interpretation
- **Model Behavior**:
The graph suggests that the model's ability to explain variance (FVU) varies significantly across layers. The black line ("eot_id") shows the most improvement, while the orange line ("n") exhibits an unrealistic spike, possibly indicating a bug or misconfiguration.
- **Reasoning Task**:
The text box implies the model is handling a multi-step reasoning question. The "eot_id" token may signal the end of the input sequence, while "n" and "yes/no" lines reflect intermediate processing steps.
- **Data Integrity**:
The 4600% FVU value is a critical outlier. If accurate, it would imply the model fails to explain 96% of the variance in that layer, which is inconsistent with typical FVU behavior. This could indicate a miscalculation or misinterpretation of the metric.
---
### Final Notes
- **Language**: The text box contains English and code-like tags (e.g., `<eot_id>`).
- **Uncertainty**: The 4600% FVU value is flagged as an anomaly, requiring further validation.
- **Context**: The graph likely represents a diagnostic tool for analyzing model performance, with "locations" referring to specific attention or processing modules in the Llama-3-70B-Instruct architecture.