## Histogram: PRM800K
### Overview
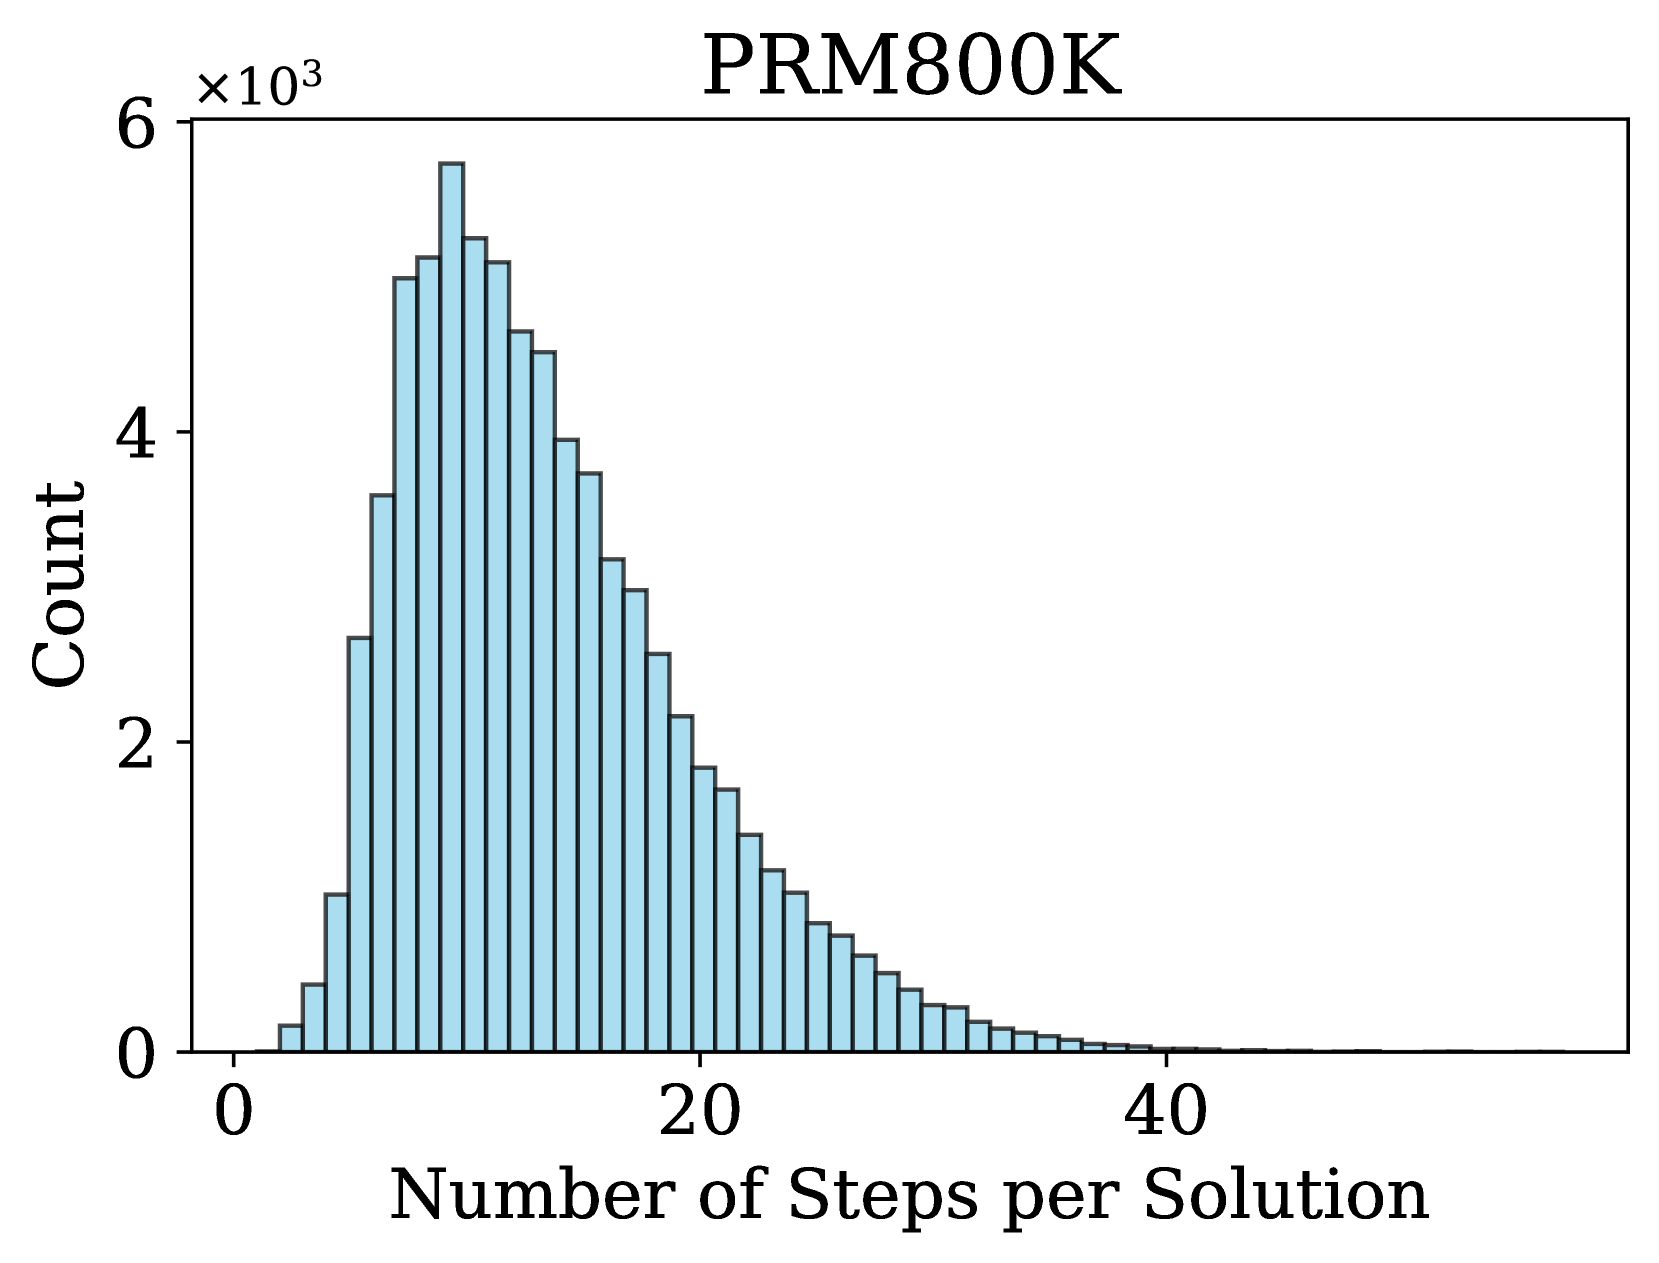
The image displays a histogram titled "PRM800K" representing the distribution of "Number of Steps per Solution." The y-axis is labeled "Count" with a scale up to 6×10³, and the x-axis ranges from 0 to 40 steps. The histogram uses blue bars to visualize the frequency of solutions grouped by step count.
### Components/Axes
- **Title**: "PRM800K" (centered at the top).
- **X-axis**: "Number of Steps per Solution" (linear scale, 0–40).
- **Y-axis**: "Count" (linear scale, 0–6×10³, with a multiplier notation "×10³" at the top).
- **Bars**: Blue, vertical bars representing frequency counts.
### Detailed Analysis
- **Peak Distribution**: The tallest bar occurs at **10 steps**, with a count of approximately **5,500** (5.5×10³).
- **Decline**: Counts decrease steadily as step numbers increase. For example:
- **15 steps**: ~4,000 counts.
- **20 steps**: ~2,500 counts.
- **25 steps**: ~1,000 counts.
- **30 steps**: ~300 counts.
- **35–40 steps**: Counts drop to near zero.
- **Shape**: The distribution is right-skewed, with a sharp decline after the peak at 10 steps.
### Key Observations
1. **Dominant Step Count**: Most solutions cluster around **10–15 steps**, indicating this is the most common range.
2. **Long Tail**: Fewer solutions require more than 20 steps, with counts diminishing significantly beyond 25 steps.
3. **Sparsity at High Steps**: Solutions requiring 35+ steps are rare, with counts below 100.
### Interpretation
The histogram suggests that the PRM800K process or system is optimized for efficiency, as the majority of solutions converge on a low step count (10–15). The right-skewed distribution implies that while most solutions are quick, a small fraction require significantly more steps, potentially indicating edge cases or outliers. The sharp decline after 10 steps highlights the effectiveness of the process in minimizing computational or iterative effort for most scenarios. The absence of data beyond 40 steps suggests either a natural upper limit or that such cases are negligible in this dataset.