## Histogram: PRM800K
### Overview
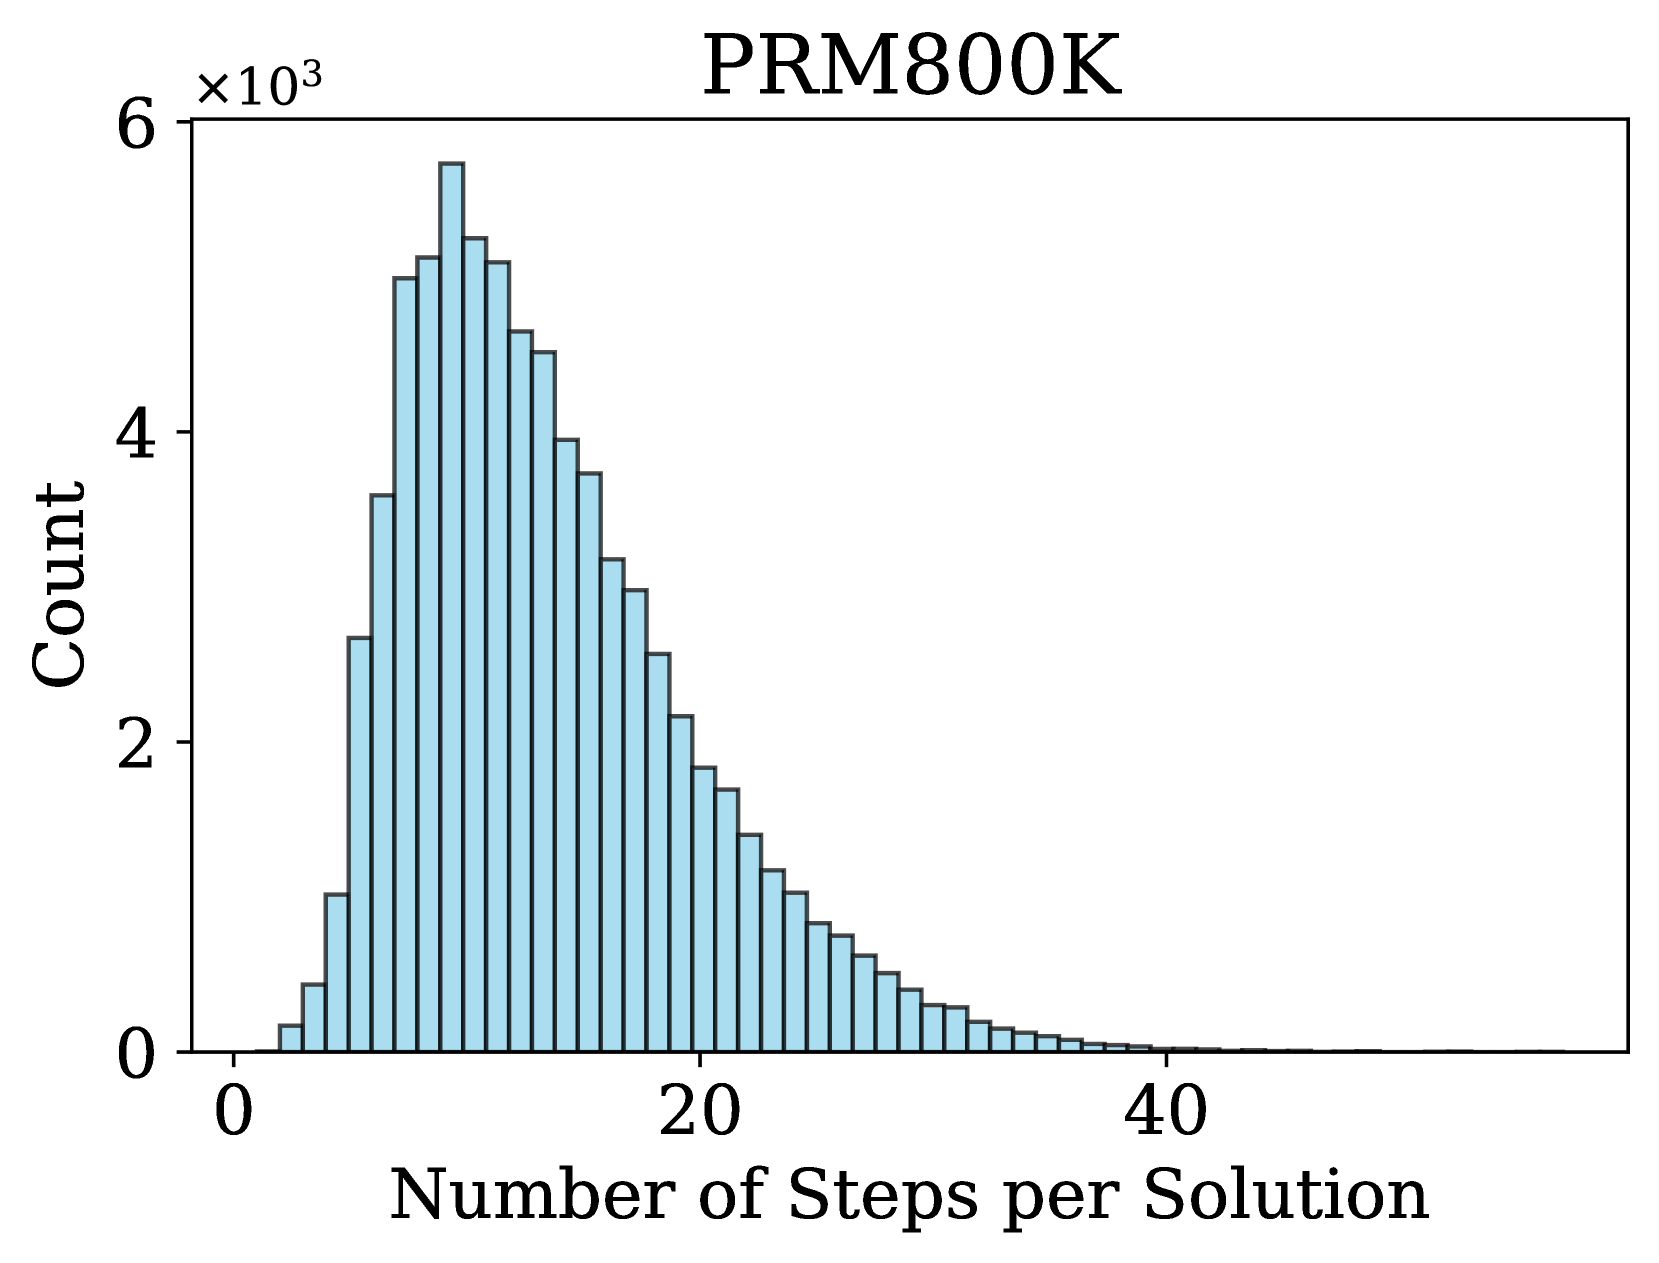
The image is a histogram showing the distribution of the number of steps per solution for an algorithm named PRM800K. The x-axis represents the number of steps, and the y-axis represents the count (frequency) of solutions. The histogram bars are light blue with dark outlines.
### Components/Axes
* **Title:** PRM800K
* **X-axis:** Number of Steps per Solution
* Scale: 0 to 40, with tick marks at intervals of 20.
* **Y-axis:** Count (x10^3)
* Scale: 0 to 6 (x10^3), with tick marks at intervals of 2 (x10^3).
### Detailed Analysis
The histogram shows a distribution that is skewed to the right. The count increases rapidly from 0 steps to a peak around 8 steps, and then decreases gradually as the number of steps increases.
* **Peak:** The highest count occurs around 8 steps. The count at 8 steps is approximately 5.8 x 10^3.
* **Tail:** The tail of the distribution extends to the right, indicating that some solutions require a significantly larger number of steps. The count approaches zero around 40 steps.
### Key Observations
* The majority of solutions require a relatively small number of steps (less than 20).
* There is a significant number of solutions that require a larger number of steps, as indicated by the long tail of the distribution.
### Interpretation
The histogram suggests that the PRM800K algorithm typically finds solutions efficiently, with most solutions requiring a small number of steps. However, there are instances where the algorithm requires significantly more steps to find a solution. This could be due to the complexity of the problem or the presence of obstacles in the search space. The distribution indicates that the algorithm's performance varies, with some solutions being found quickly and others requiring more extensive search.