\n
## Histogram: PRM800K - Number of Steps per Solution
### Overview
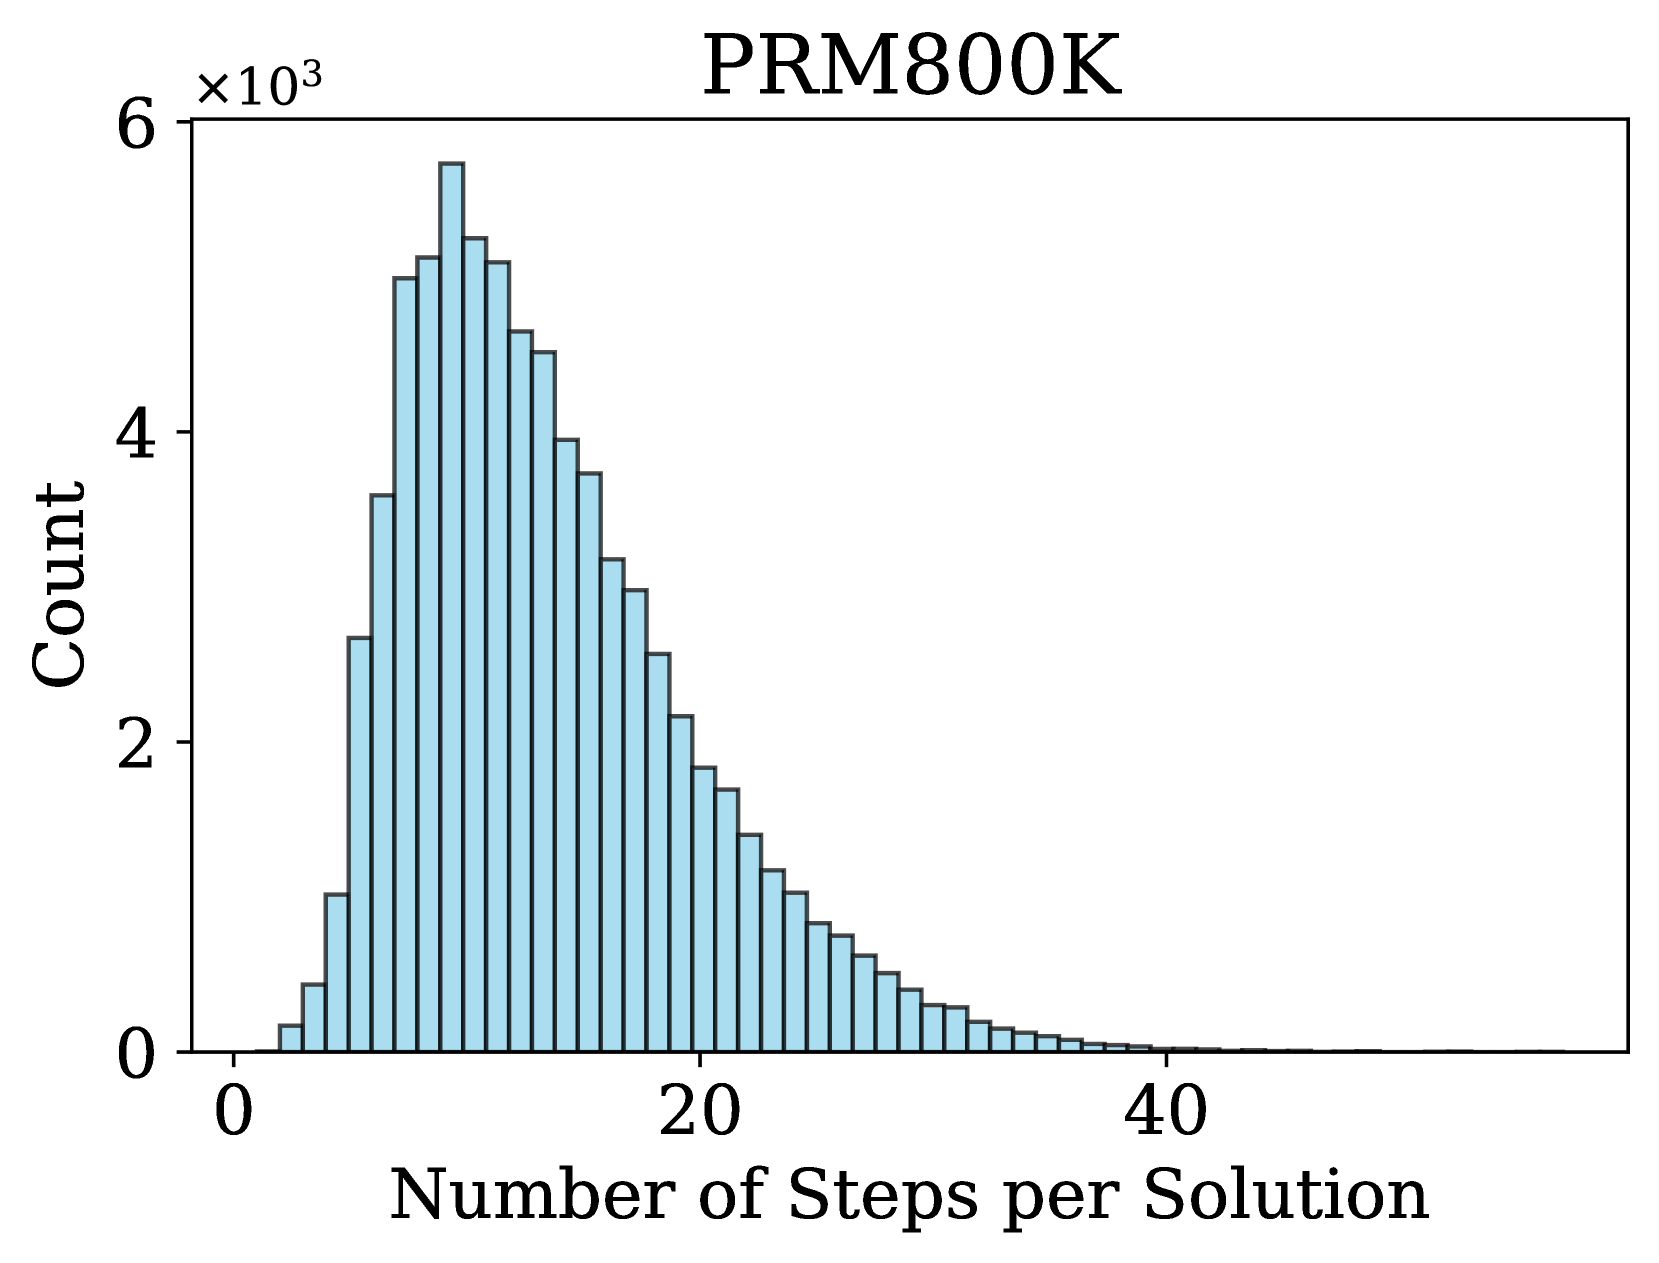
The image presents a histogram visualizing the distribution of the number of steps per solution for a dataset labeled "PRM800K". The x-axis represents the number of steps, and the y-axis represents the count (frequency) of solutions falling into each step range. The distribution appears approximately normal, skewed slightly to the right.
### Components/Axes
* **Title:** PRM800K (positioned at the top-center)
* **X-axis Label:** Number of Steps per Solution (positioned at the bottom-center)
* **Y-axis Label:** Count (positioned at the left-center)
* **Y-axis Scale:** The y-axis is scaled from 0 to 6 x 10<sup>3</sup> (6000).
* **X-axis Scale:** The x-axis is scaled from 0 to approximately 40.
* **Bars:** The histogram consists of vertical bars representing the frequency of solutions for each step count. The bars are light blue.
### Detailed Analysis
The histogram shows a peak in the count around 8-12 steps. The distribution is roughly symmetrical around this peak, but with a longer tail extending towards higher step counts.
Here's an approximate breakdown of the data, reading from left to right:
* **0-2 Steps:** Approximately 200-300 count.
* **2-4 Steps:** Approximately 500-600 count.
* **4-6 Steps:** Approximately 800-900 count.
* **6-8 Steps:** Approximately 1100-1200 count.
* **8-10 Steps:** Approximately 1500-1600 count. (Peak)
* **10-12 Steps:** Approximately 1400-1500 count.
* **12-14 Steps:** Approximately 1100-1200 count.
* **14-16 Steps:** Approximately 800-900 count.
* **16-18 Steps:** Approximately 500-600 count.
* **18-20 Steps:** Approximately 300-400 count.
* **20-22 Steps:** Approximately 200-300 count.
* **22-24 Steps:** Approximately 100-200 count.
* **24-26 Steps:** Approximately 50-100 count.
* **26-28 Steps:** Approximately 20-50 count.
* **28-30 Steps:** Approximately 10-20 count.
* **30-32 Steps:** Approximately 5-10 count.
* **32-34 Steps:** Approximately 2-5 count.
* **34-36 Steps:** Approximately 1-2 count.
* **36-40 Steps:** Approximately 0-1 count.
The counts decrease steadily as the number of steps increases beyond the peak.
### Key Observations
* The most frequent number of steps per solution is between 8 and 12.
* The distribution is unimodal (single peak).
* The distribution is not perfectly symmetrical; it exhibits a slight positive skew.
* The number of solutions requiring more than 20 steps is relatively low.
### Interpretation
This histogram likely represents the performance of an algorithm or process (PRM800K) in finding solutions. The number of steps could correspond to the computational effort or iterations required to reach a solution. The fact that most solutions are found within 8-12 steps suggests that the algorithm is relatively efficient for a significant portion of the problem space. The rightward skew indicates that some solutions require considerably more steps, potentially due to the complexity of those specific instances. This could be indicative of a need to optimize the algorithm for handling more challenging cases or to investigate the characteristics of those instances that require a higher number of steps. The data suggests that the algorithm is generally effective, but there's room for improvement in handling the more difficult scenarios.