## Line Chart: Similarity vs. Reasoning Step for Various AI Models
### Overview
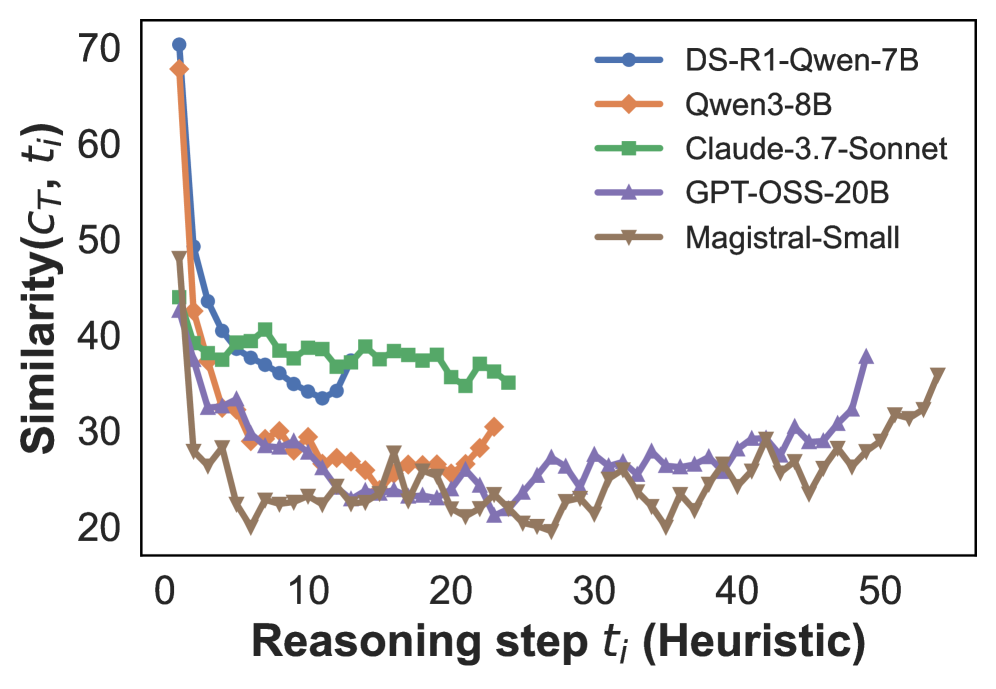
This image is a line chart comparing the performance of five different AI models. It plots a "Similarity" metric against the number of "Reasoning steps" taken. All models exhibit a sharp initial decline in similarity, followed by varying patterns of fluctuation and stabilization over subsequent steps.
### Components/Axes
* **Chart Type:** Multi-series line chart with markers.
* **Y-Axis (Vertical):**
* **Label:** `Similarity(C_T, t_i)`
* **Scale:** Linear, ranging from 20 to 70.
* **Major Ticks:** 20, 30, 40, 50, 60, 70.
* **X-Axis (Horizontal):**
* **Label:** `Reasoning step t_i (Heuristic)`
* **Scale:** Linear, ranging from 0 to approximately 55.
* **Major Ticks:** 0, 10, 20, 30, 40, 50.
* **Legend (Top-Right Corner):** Contains five entries, each associating a model name with a specific line color and marker shape.
1. **DS-R1-Qwen-7B:** Blue line with circle markers.
2. **Qwen3-8B:** Orange line with diamond markers.
3. **Claude-3.7-Sonnet:** Green line with square markers.
4. **GPT-OSS-20B:** Purple line with upward-pointing triangle markers.
5. **Magistral-Small:** Brown line with downward-pointing triangle markers.
### Detailed Analysis
**Trend Verification & Data Point Extraction (Approximate Values):**
1. **DS-R1-Qwen-7B (Blue, Circles):**
* **Trend:** Starts highest, plummets steeply, then fluctuates in the mid-range.
* **Points:** Starts at ~70 (step 0). Drops to ~40 by step 5. Fluctuates between ~30 and ~40 from steps 5 to 25. Data series ends around step 25.
2. **Qwen3-8B (Orange, Diamonds):**
* **Trend:** Starts very high, drops sharply, then shows a slight recovery trend in later steps.
* **Points:** Starts at ~68 (step 0). Drops to ~30 by step 5. Fluctuates between ~25 and ~30 from steps 5 to 20. Shows a slight upward trend to ~30 by step 25.
3. **Claude-3.7-Sonnet (Green, Squares):**
* **Trend:** Starts moderately high, drops, then maintains the most stable and highest plateau among all models after the initial drop.
* **Points:** Starts at ~45 (step 0). Drops to ~40 by step 5. Remains relatively stable, fluctuating between ~35 and ~40 from steps 5 to 25. Data series ends around step 25.
4. **GPT-OSS-20B (Purple, Up-Triangles):**
* **Trend:** Starts moderately, drops, fluctuates at a lower level, then shows a distinct upward trend in the final segment.
* **Points:** Starts at ~43 (step 0). Drops to ~32 by step 5. Fluctuates between ~20 and ~30 from steps 5 to 45. Shows a clear upward trend from step 45, reaching ~38 by step 50.
5. **Magistral-Small (Brown, Down-Triangles):**
* **Trend:** Starts moderately, experiences the deepest drop, fluctuates at the lowest level for most of the chart, and ends with an upward trend.
* **Points:** Starts at ~48 (step 0). Drops sharply to ~20 by step 7. Fluctuates between ~20 and ~25 from steps 7 to 45. Shows an upward trend from step 45, reaching ~36 by step 55 (the furthest data point on the X-axis).
### Key Observations
* **Universal Initial Drop:** All five models show a dramatic decrease in the `Similarity(C_T, t_i)` metric within the first 5-7 reasoning steps.
* **Post-Drop Stratification:** After the initial drop, a clear performance hierarchy emerges and persists for most of the chart: Claude-3.7-Sonnet (green) maintains the highest similarity, followed by DS-R1-Qwen-7B (blue), then Qwen3-8B (orange) and GPT-OSS-20B (purple) in the middle, with Magistral-Small (brown) consistently at the lowest level until the final steps.
* **Late-Stage Divergence:** In the later steps (beyond step 40), GPT-OSS-20B and Magistral-Small exhibit a notable upward trend, while the other models' data series have ended.
* **Data Range Variance:** The models are not tested over the same number of steps. Claude-3.7-Sonnet and DS-R1-Qwen-7B data ends around step 25, Qwen3-8B around step 25, GPT-OSS-20B extends to step 50, and Magistral-Small extends the furthest to step 55.
### Interpretation
The chart likely visualizes how the internal reasoning or output of different AI models diverges from an initial reference point (`C_T`) as they perform more heuristic reasoning steps (`t_i`). The "Similarity" metric is presumably a measure of consistency or alignment.
The data suggests that **all models undergo a significant shift or "reasoning drift" very early in the process**. The subsequent stratification indicates that different models have different capacities to maintain similarity (or resist drift) during extended reasoning. Claude-3.7-Sonnet appears most robust in this specific test.
The late upward trend for GPT-OSS-20B and Magistral-Small is intriguing. It could indicate a form of "re-convergence" or a cyclical pattern in their reasoning processes over very long chains, or it might be an artifact of the specific heuristic steps being measured. The varying end points for each model's data series suggest the experiment or evaluation was not uniform in length for all models, which is a critical context for comparing their full performance curves.