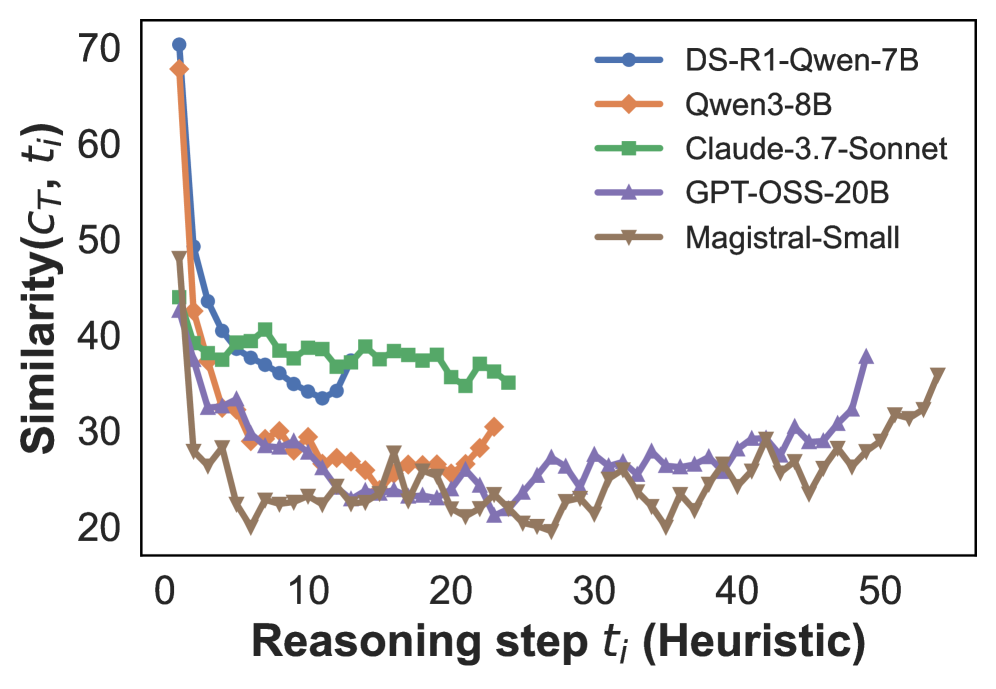
## Line Graph: Similarity Trends Across Reasoning Steps
### Overview
The image is a line graph comparing the similarity metric (C_T, t_i) across five different models as a function of reasoning steps (t_i, Heuristic). The y-axis represents similarity scores (20–70), and the x-axis represents reasoning steps (0–50). Five distinct data series are plotted, each with unique markers and colors.
### Components/Axes
- **X-axis**: "Reasoning step t_i (Heuristic)" (0–50, linear scale).
- **Y-axis**: "Similarity(C_T, t_i)" (20–70, linear scale).
- **Legend**: Located in the top-right corner, mapping colors to models:
- **Blue (●)**: DS-R1-Qwen-7B
- **Orange (◆)**: Qwen3-8B
- **Green (■)**: Claude-3.7-Sonnet
- **Purple (★)**: GPT-OSS-20B
- **Brown (▲)**: Magistral-Small
### Detailed Analysis
1. **DS-R1-Qwen-7B (Blue)**:
- Starts at ~70 similarity at t_i=0.
- Sharp decline to ~35 by t_i=10.
- Stabilizes with minor fluctuations (~35–40) from t_i=10 to 50.
2. **Qwen3-8B (Orange)**:
- Begins at ~65 similarity at t_i=0.
- Drops to ~25 by t_i=10.
- Fluctuates between ~25–30 from t_i=10 to 50.
3. **Claude-3.7-Sonnet (Green)**:
- Starts at ~40 similarity at t_i=0.
- Gradual decline to ~35 by t_i=10.
- Remains relatively flat (~35–38) from t_i=10 to 50.
4. **GPT-OSS-20B (Purple)**:
- Begins at ~35 similarity at t_i=0.
- Sharp drop to ~20 by t_i=10.
- Fluctuates between ~20–30 from t_i=10 to 50.
5. **Magistral-Small (Brown)**:
- Starts at ~25 similarity at t_i=0.
- Drops to ~20 by t_i=10.
- Fluctuates between ~20–30 from t_i=10 to 50.
### Key Observations
- **Initial Decline**: All models show a sharp drop in similarity within the first 10 reasoning steps.
- **Stability**: Claude-3.7-Sonnet (green) exhibits the most stable performance after t_i=10.
- **Volatility**: Qwen3-8B (orange) and GPT-OSS-20B (purple) show significant fluctuations post-t_i=10.
- **High Initial Similarity**: DS-R1-Qwen-7B (blue) starts with the highest similarity but declines sharply.
### Interpretation
The data suggests that model performance (as measured by similarity) varies significantly across reasoning steps. The steep initial decline for all models may indicate a "warm-up" phase where initial reasoning steps are less effective. Claude-3.7-Sonnet’s stability post-t_i=10 implies consistent reasoning quality, while Qwen3-8B and GPT-OSS-20B’s volatility suggests less predictable performance. DS-R1-Qwen-7B’s high initial similarity but subsequent drop could reflect overfitting or reliance on early heuristics. The graph highlights trade-offs between early performance and long-term consistency across models.