\n
## Diagram: Secure Feature Similarity Computation
### Overview
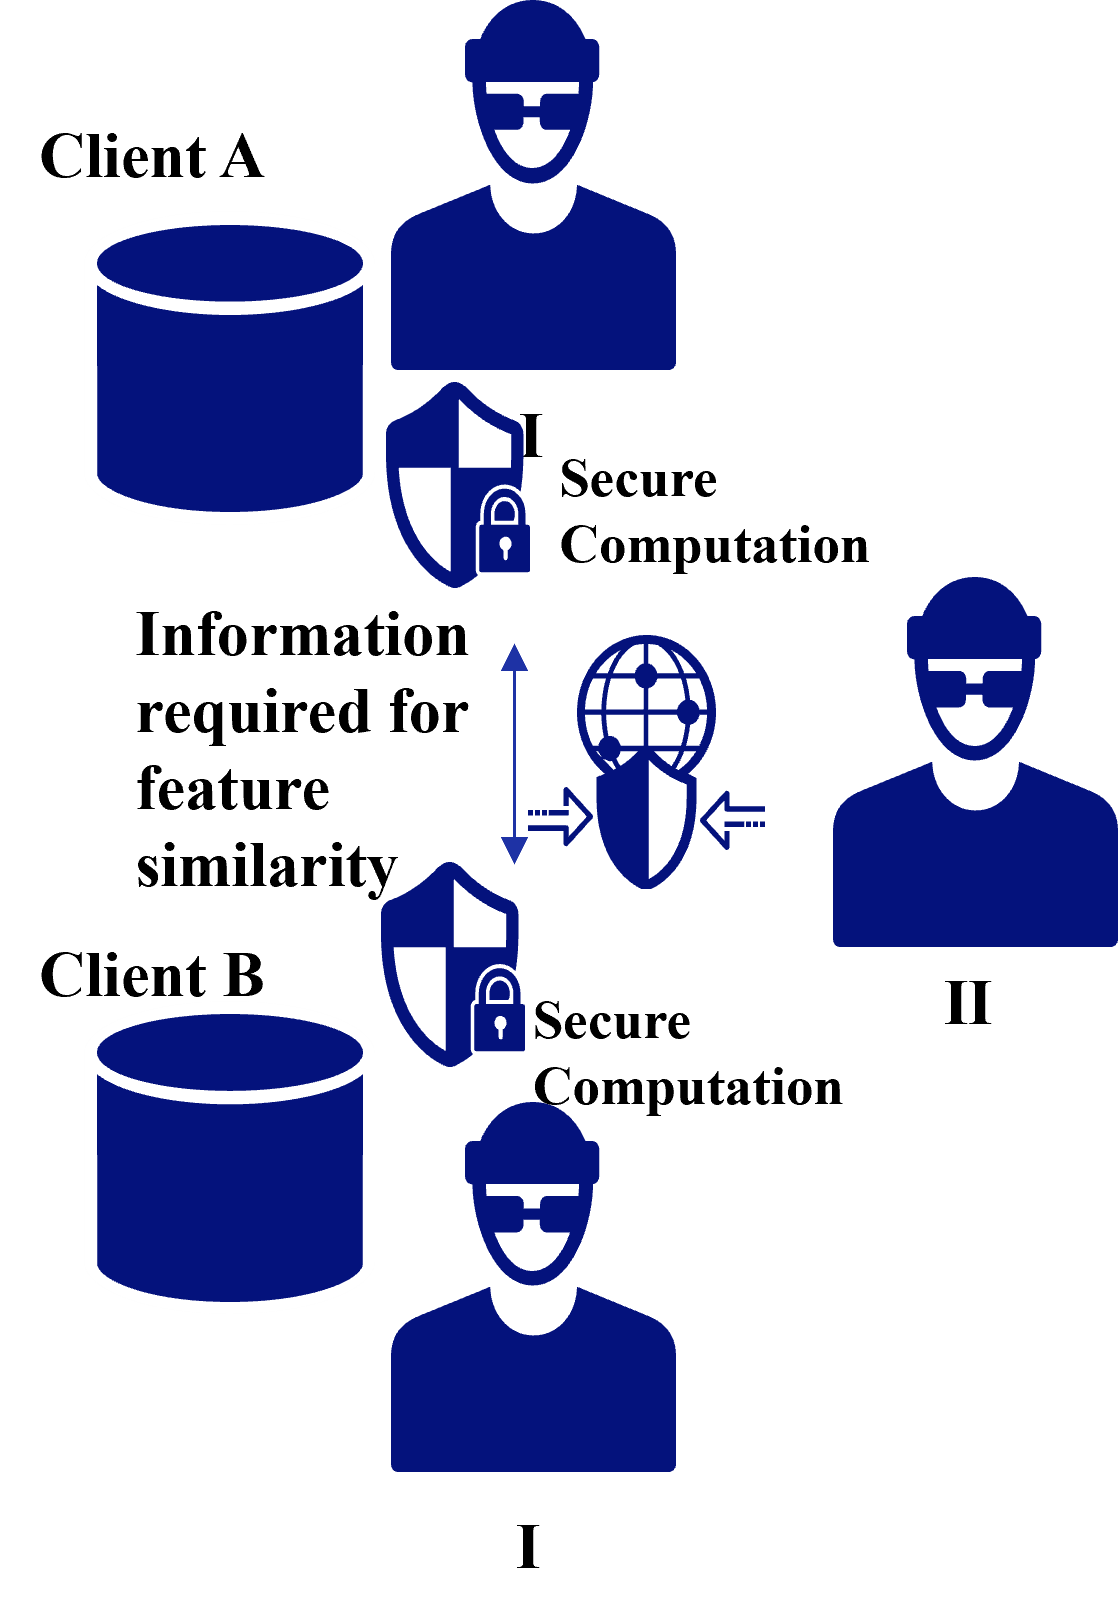
The image is a diagram illustrating a secure computation process for determining feature similarity between data held by two clients (Client A and Client B). It depicts a flow of information through secure computation modules, with an emphasis on privacy.
### Components/Axes
The diagram consists of the following components:
* **Client A:** Represented by a dark blue cylinder (database), a masked face, and the label "Client A" positioned at the top-left.
* **Client B:** Represented by a dark blue cylinder (database), a masked face, and the label "Client B" positioned at the bottom-left.
* **Secure Computation (I):** A padlock symbol with the text "Secure Computation" positioned between Client A and the central globe.
* **Secure Computation (II):** A padlock symbol with the text "Secure Computation" positioned between Client B and the central globe.
* **Globe:** A stylized globe with dotted arrows indicating information flow, positioned in the center of the diagram.
* **Text Label:** "Information required for feature similarity" positioned between the two secure computation modules and the globe.
* **Labels I & II:** Labels "I" and "II" are positioned near the masked faces of Client A and Client B respectively.
### Detailed Analysis / Content Details
The diagram illustrates a process where:
1. Client A and Client B each possess a data store (represented by the cylinders).
2. Information from both clients is sent to respective "Secure Computation" modules.
3. The Secure Computation modules process the information and send it to a central point represented by the globe.
4. The globe appears to facilitate the comparison of features, as indicated by the dotted arrows showing information exchange.
5. The masked faces suggest that the identities of the clients are protected during the process.
There are no numerical values or specific data points present in the diagram. It is a conceptual illustration of a process.
### Key Observations
* The use of masked faces and "Secure Computation" modules emphasizes the privacy-preserving nature of the process.
* The globe suggests a centralized computation or comparison point.
* The dotted arrows indicate a two-way flow of information, implying that both clients contribute to the feature similarity calculation.
* The labels "I" and "II" do not appear to have a clear functional purpose within the diagram, potentially serving as identifiers for different stages or components.
### Interpretation
The diagram depicts a secure multi-party computation scenario. Clients A and B wish to determine the similarity of features within their respective datasets without revealing the underlying data to each other or to a central authority. The "Secure Computation" modules likely employ techniques like differential privacy, homomorphic encryption, or secure multi-party computation protocols to enable this. The globe represents a trusted environment where the computation takes place, ensuring that only the similarity score (or related information) is revealed, not the raw data.
The diagram highlights the importance of privacy in data analysis and the use of cryptographic techniques to enable collaborative data processing without compromising confidentiality. The absence of specific details suggests that the diagram is intended to convey a general concept rather than a specific implementation. The dotted arrows suggest a communication protocol, but the nature of that protocol is not specified.