## Line Chart: Mstencil/s vs. Input Length
### Overview
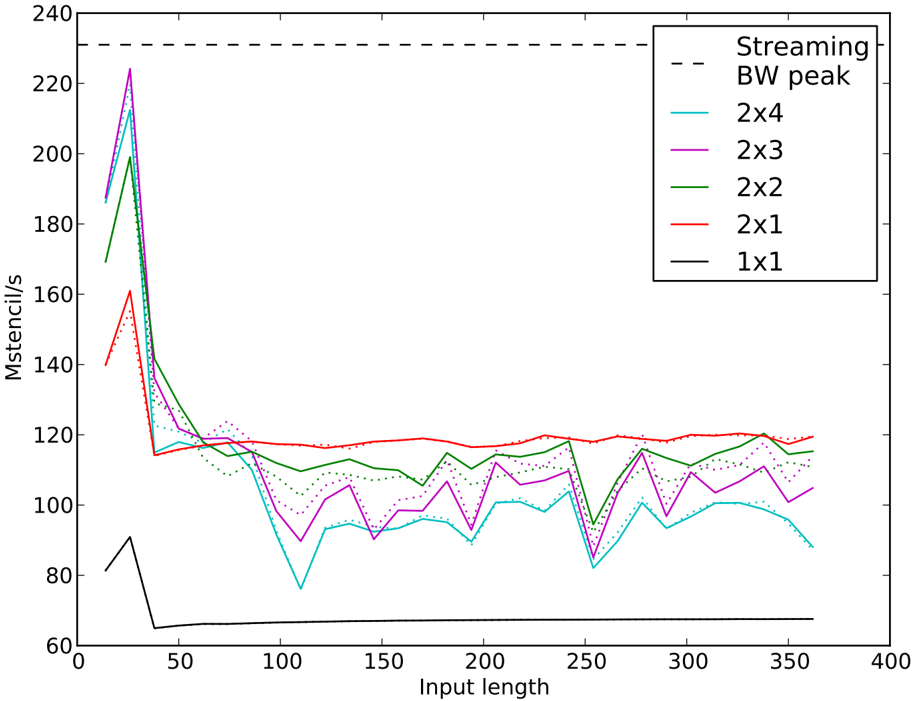
The image is a line chart comparing the performance (Mstencil/s) of different configurations (2x4, 2x3, 2x2, 2x1, 1x1) against varying input lengths. A horizontal dashed line indicates the Streaming Bandwidth (BW) peak. The chart shows how the performance of each configuration changes as the input length increases.
### Components/Axes
* **X-axis:** Input length, ranging from 0 to 400.
* **Y-axis:** Mstencil/s, ranging from 60 to 240.
* **Legend (top-right):**
* Dashed Black Line: Streaming BW peak
* Cyan Line: 2x4
* Purple Line: 2x3
* Green Line: 2x2
* Red Line: 2x1
* Black Line: 1x1
### Detailed Analysis
* **Streaming BW peak:** A horizontal dashed black line at approximately 230 Mstencil/s.
* **2x4 (Cyan):**
* Trend: Starts high, drops sharply, then fluctuates between approximately 80 and 100 Mstencil/s.
* Data Points: Starts at ~190 Mstencil/s at input length 20, drops to ~115 at input length 40, fluctuates between ~80 and ~100 Mstencil/s for input lengths between 80 and 360.
* **2x3 (Purple):**
* Trend: Starts high, drops sharply, then fluctuates between approximately 95 and 120 Mstencil/s.
* Data Points: Starts at ~200 Mstencil/s at input length 20, drops to ~120 at input length 40, fluctuates between ~95 and ~120 Mstencil/s for input lengths between 80 and 360.
* **2x2 (Green):**
* Trend: Starts high, drops sharply, then stabilizes around 115-120 Mstencil/s.
* Data Points: Starts at ~170 Mstencil/s at input length 20, drops to ~115 at input length 40, stabilizes around ~115-120 Mstencil/s for input lengths between 80 and 360.
* **2x1 (Red):**
* Trend: Starts relatively high, drops sharply, then stabilizes around 115-120 Mstencil/s.
* Data Points: Starts at ~140 Mstencil/s at input length 20, drops to ~115 at input length 40, stabilizes around ~115-120 Mstencil/s for input lengths between 80 and 360.
* **1x1 (Black):**
* Trend: Starts low, rises slightly, then remains relatively constant at a low value.
* Data Points: Starts at ~80 Mstencil/s at input length 20, rises to ~65 at input length 40, remains relatively constant at ~65 Mstencil/s for input lengths between 80 and 360.
### Key Observations
* All configurations except 1x1 show a significant drop in performance between input lengths of 20 and 40.
* The 1x1 configuration has the lowest performance across all input lengths.
* The Streaming BW peak is significantly higher than the performance of any configuration for larger input lengths.
* The 2x2 and 2x1 configurations have similar performance after the initial drop.
* The 2x4 and 2x3 configurations have similar performance after the initial drop, but are lower than 2x2 and 2x1.
### Interpretation
The chart illustrates the performance characteristics of different stencil configurations as the input length varies. The initial drop in performance for most configurations suggests an initial overhead or setup cost that is amortized as the input length increases. The consistently low performance of the 1x1 configuration indicates that it is less efficient than the other configurations, possibly due to a lack of parallelism or optimization. The Streaming BW peak represents a theoretical maximum performance, which is not achieved by any of the configurations at larger input lengths, suggesting that there are bottlenecks or limitations in the implementation or hardware. The similar performance of 2x2 and 2x1, and 2x4 and 2x3, might indicate that the performance is more sensitive to the first dimension of the configuration.