## Line Chart: Performance Benchmark (Mstencil/s vs Input Length)
### Overview
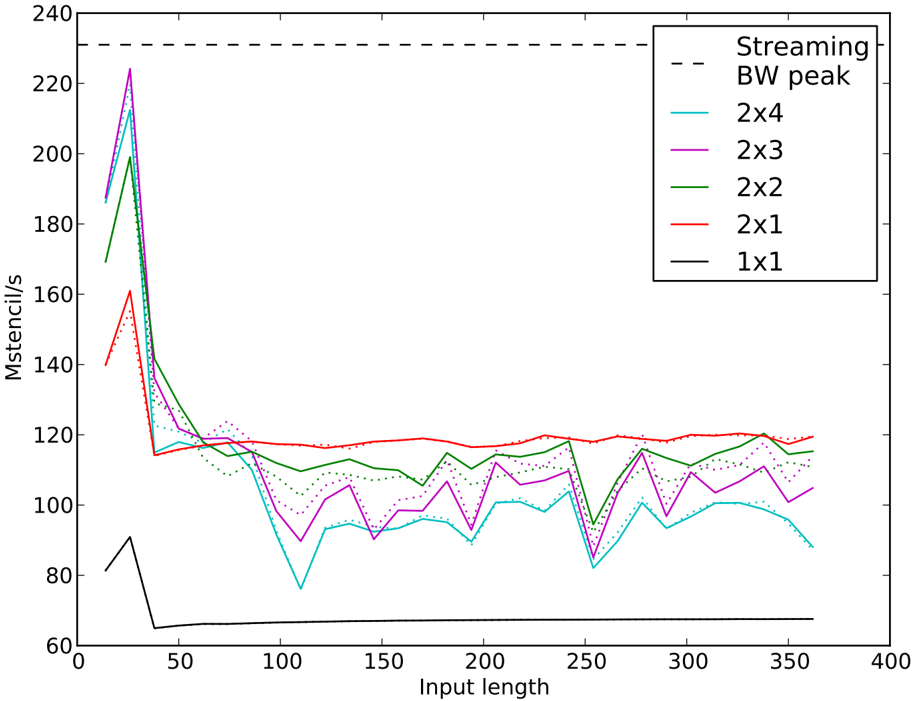
This chart illustrates the performance of five different computational configurations (labeled 1x1, 2x1, 2x2, 2x3, and 2x4) measured in "Mstencil/s" (Millions of stencils per second) against varying "Input length." A horizontal dashed line represents the "Streaming BW peak" (Streaming Bandwidth peak). The data shows a significant performance spike at low input lengths, followed by a stabilization phase where performance varies significantly by configuration.
### Components/Axes
* **Y-Axis:** Labeled "Mstencil/s". The scale ranges from 60 to 240, with major increments of 20.
* **X-Axis:** Labeled "Input length". The scale ranges from 0 to 400, with major increments of 50.
* **Legend (Positioned Top-Right):**
* **Streaming BW peak:** Dashed black line.
* **2x4:** Cyan line.
* **2x3:** Magenta line.
* **2x2:** Green line.
* **2x1:** Red line.
* **1x1:** Black line.
* **Data Series:** Each configuration (except 1x1) includes a solid line and a dotted line of the same color, likely representing two different runs or sub-configurations of the same parameter set.
### Detailed Analysis
The chart can be segmented into two distinct performance regions: the "Cache-Resident" region (Input length < 50) and the "Memory-Bound" region (Input length > 50).
**1. Streaming BW Peak (Reference)**
* **Trend:** A constant horizontal line.
* **Value:** Approximately 232 Mstencil/s.
**2. Cache-Resident Region (Input length ~25)**
* **Trend:** All configurations exhibit a sharp, localized performance spike.
* **Values (Approximate):**
* **2x3 (Magenta):** Peaks highest at ~225 Mstencil/s.
* **2x4 (Cyan):** Peaks at ~212 Mstencil/s.
* **2x2 (Green):** Peaks at ~198 Mstencil/s.
* **2x1 (Red):** Peaks at ~160 Mstencil/s.
* **1x1 (Black):** Peaks at ~90 Mstencil/s.
**3. Memory-Bound Region (Input length 50 to 360)**
* **1x1 (Black):** Drops to ~65 Mstencil/s and remains almost perfectly flat for the remainder of the x-axis.
* **2x1 (Red):** Drops to ~115–120 Mstencil/s and maintains this level with high stability. It is the highest-performing multi-core configuration in this region.
* **2x2 (Green):** Drops to ~115 Mstencil/s, then fluctuates between 110 and 120 Mstencil/s.
* **2x3 (Magenta):** Drops to ~115 Mstencil/s, then shows significant volatility, dipping as low as ~85 Mstencil/s (at x=250) and recovering to ~115 Mstencil/s.
* **2x4 (Cyan):** Drops to ~115 Mstencil/s, then shows the most volatility and generally the lowest performance of the multi-core set, frequently dipping between 80 and 100 Mstencil/s.
### Key Observations
* **Inverse Scaling:** There is a clear inverse relationship between the configuration number (e.g., 2x4) and performance in the memory-bound region. The 2x1 configuration consistently outperforms the 2x2, 2x3, and 2x4 configurations.
* **The "Spike" Phenomenon:** The sharp performance peak at an input length of ~25 suggests that the data fits entirely within the CPU's L1 or L2 cache at this size, allowing for maximum throughput.
* **Performance Degradation:** Once the input length exceeds the cache capacity (post-50), performance drops by 40–50% across all configurations, indicating a transition to memory-bandwidth-limited execution.
* **Volatility:** Higher-order configurations (2x3, 2x4) exhibit significantly more performance instability (jitter) compared to the 2x1 configuration.
### Interpretation
This data likely represents a stencil computation benchmark on a multi-core processor.
* **Cache vs. Memory:** The sharp drop-off after an input length of 25 is a classic signature of cache-fitting. When the working set is small enough to fit in the cache, the processor is compute-bound and achieves high throughput. When the working set exceeds the cache, the processor becomes memory-bound, limited by the "Streaming BW peak."
* **Overhead Analysis:** The fact that 2x4 performs worse than 2x1 in the memory-bound region is highly significant. It suggests that for this specific algorithm, the overhead of parallelization (likely cache coherency traffic, thread synchronization, or memory bus contention) outweighs the benefits of using more cores. The 2x1 configuration appears to be the "sweet spot" for this hardware/algorithm combination, providing the best balance of parallel throughput without incurring the penalties seen in the 2x3 and 2x4 configurations.