## Line Chart: Stencil Computation Performance vs. Input Length
### Overview
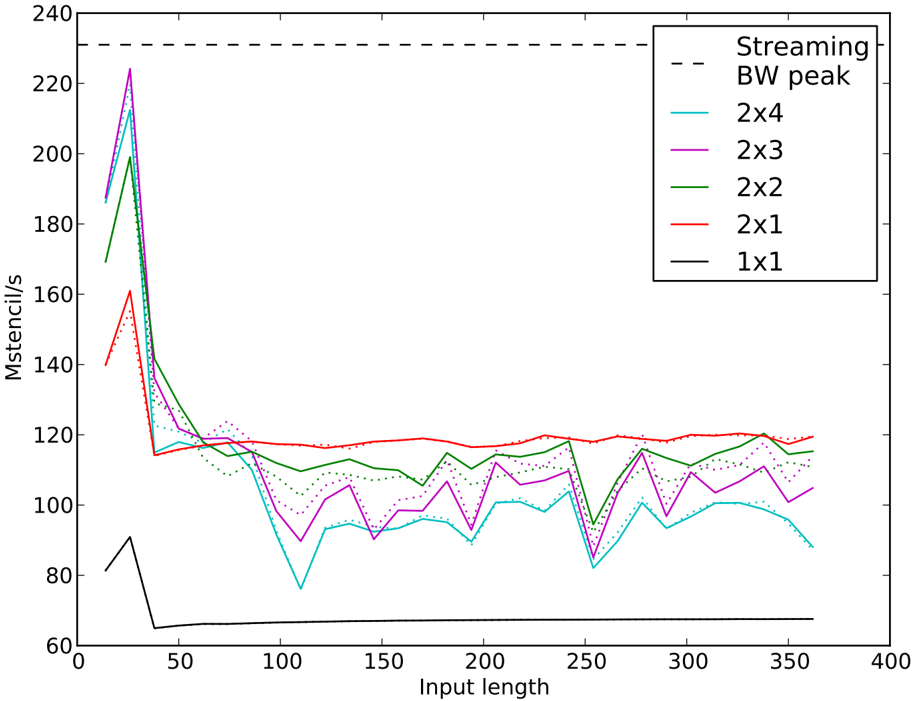
The image is a line chart plotting the performance of various stencil computation configurations against input length. Performance is measured in "Mstencil/s" (millions of stencil operations per second). The chart compares five different stencil sizes (1x1, 2x1, 2x2, 2x3, 2x4) and includes a reference line for the theoretical streaming bandwidth peak.
### Components/Axes
* **X-Axis:** Labeled "Input length". The scale runs from 0 to 400, with major tick marks at intervals of 50 (0, 50, 100, 150, 200, 250, 300, 350, 400).
* **Y-Axis:** Labeled "Mstencil/s". The scale runs from 60 to 240, with major tick marks at intervals of 20 (60, 80, 100, 120, 140, 160, 180, 200, 220, 240).
* **Legend:** Located in the top-right corner of the plot area. It contains the following entries:
* `-- Streaming BW peak` (Black dashed line)
* `— 2x4` (Cyan solid line)
* `— 2x3` (Magenta solid line)
* `— 2x2` (Green solid line)
* `— 2x1` (Red solid line)
* `— 1x1` (Black solid line)
* **Data Series:** Each configuration is represented by a solid line of its designated color. Some lines appear to have a dotted variant overlaid, likely representing a different measurement or run, but the legend only specifies the solid lines.
### Detailed Analysis
**Trend Verification & Data Points (Approximate):**
1. **Streaming BW peak (Black dashed line):**
* **Trend:** A constant horizontal line.
* **Value:** Approximately 230 Mstencil/s across all input lengths.
2. **2x4 (Cyan line):**
* **Trend:** Starts very high, drops sharply, then exhibits significant fluctuations with a general downward trend as input length increases.
* **Key Points:** Peak ~215 Mstencil/s at input length ~25. Sharp drop to ~115 Mstencil/s at length ~50. Fluctuates between ~80 and ~100 Mstencil/s for lengths >100.
3. **2x3 (Magenta line):**
* **Trend:** Similar to 2x4: very high initial peak, sharp drop, then fluctuating performance.
* **Key Points:** Highest peak of all series at ~225 Mstencil/s at length ~25. Drops to ~115 Mstencil/s at length ~50. Fluctuates between ~90 and ~110 Mstencil/s for lengths >100.
4. **2x2 (Green line):**
* **Trend:** High initial peak, sharp drop, then relatively stable but fluctuating performance.
* **Key Points:** Peak ~200 Mstencil/s at length ~25. Drops to ~120 Mstencil/s at length ~50. Fluctuates between ~105 and ~120 Mstencil/s for lengths >100.
5. **2x1 (Red line):**
* **Trend:** Moderate initial peak, sharp drop, then the most stable performance of all series.
* **Key Points:** Peak ~160 Mstencil/s at length ~25. Drops to ~115 Mstencil/s at length ~50. Maintains a very steady performance around ~115-120 Mstencil/s for lengths >50.
6. **1x1 (Black solid line):**
* **Trend:** Low initial peak, sharp drop, then flat, stable performance at the lowest level.
* **Key Points:** Peak ~90 Mstencil/s at length ~25. Drops to ~65 Mstencil/s at length ~50. Remains constant at ~65 Mstencil/s for all lengths >50.
**Spatial Grounding:** The legend is positioned in the top-right quadrant, overlapping the upper portion of the data lines. The "Streaming BW peak" dashed line runs across the very top of the plot area, just below the 240 Mstencil/s mark.
### Key Observations
1. **Universal Initial Peak:** All configurations show a performance peak at a very small input length (approximately 25), followed by a sharp decline.
2. **Performance Hierarchy:** For input lengths >50, a clear performance hierarchy is established: `2x1` (red) is consistently the fastest, followed by `2x2` (green), then `2x3` (magenta) and `2x4` (cyan) which are similar and lower, with `1x1` (black) being the slowest by a significant margin.
3. **Stability vs. Complexity:** The simpler `2x1` stencil shows remarkably stable performance after the initial drop. More complex stencils (`2x3`, `2x4`) exhibit greater volatility and lower sustained performance.
4. **Bandwidth Limit:** The performance of all stencils, even at their peak, remains below the indicated "Streaming BW peak" of ~230 Mstencil/s. The `2x3` configuration comes closest to this limit at its peak.
5. **1x1 Anomaly:** The `1x1` stencil, which represents a simple pointwise operation, has the lowest performance, suggesting the benchmark is measuring a memory-bound operation where even minimal computation adds overhead compared to pure streaming.
### Interpretation
This chart demonstrates the performance characteristics of stencil computations, which are fundamental in scientific computing (e.g., solving partial differential equations). The data suggests:
* **Memory Bandwidth is the Primary Constraint:** The fact that all performance curves lie below the "Streaming BW peak" line indicates that these operations are limited by how fast data can be moved from memory, not by computational speed. The initial peak at small input lengths likely occurs because the working set fits entirely in fast CPU cache, avoiding main memory access.
* **Trade-off Between Stencil Size and Performance:** Larger stencils (2x4, 2x3) require accessing more neighboring data points per output element. This increases memory traffic and pressure on cache, leading to lower and more volatile sustained performance compared to the simpler `2x1` stencil.
* **The `2x1` Sweet Spot:** The `2x1` configuration appears to strike an optimal balance for this specific system and benchmark, achieving the highest stable performance. It likely has a memory access pattern that aligns well with the hardware's cache line size and prefetching capabilities.
* **Practical Implication:** For applications using these stencils, the choice of input length is critical. Performance is best for very small problems (cache-resident) but degrades rapidly. For larger problems, using the simplest effective stencil (`2x1` in this case) yields the most predictable and highest throughput. The `1x1` result serves as a baseline, showing the overhead of the benchmarking framework itself.