## Line Graph: Streaming Bandwidth Peak Performance
### Overview
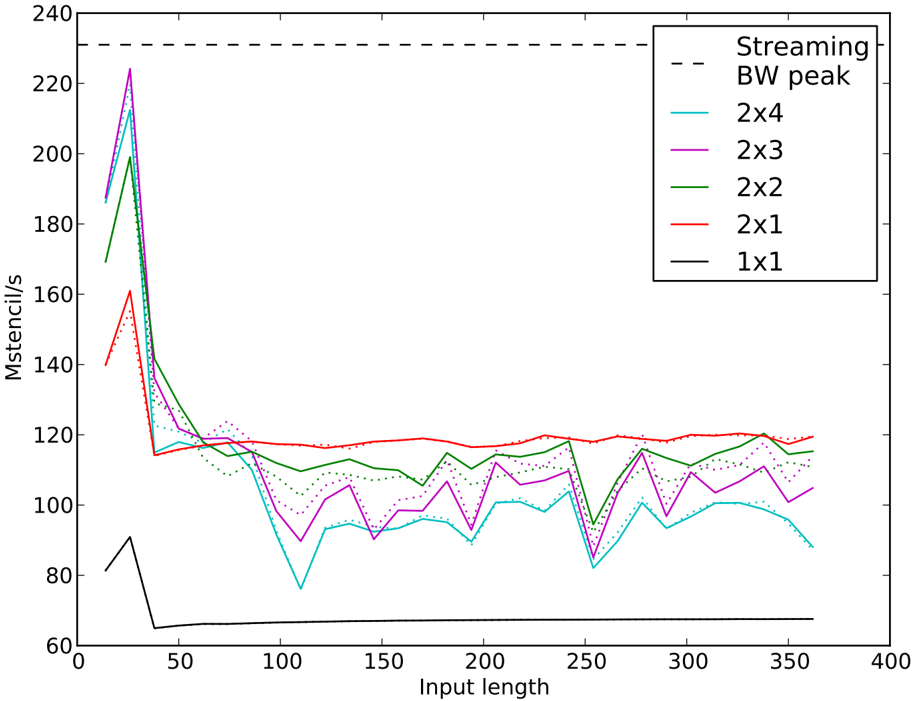
The graph illustrates the performance of different streaming bandwidth (BW) configurations over varying input lengths, measured in Mstencil/s. Key elements include a legend in the top-right corner, a dashed "BW peak" reference line at 240 Mstencil/s, and six data series representing different BW multipliers (2x4, 2x3, 2x2, 2x1, and 1x1).
### Components/Axes
- **X-axis (Input length)**: Ranges from 0 to 400 in increments of 50.
- **Y-axis (Mstencil/s)**: Ranges from 60 to 240 in increments of 20.
- **Legend**: Positioned in the top-right corner, with color-coded labels:
- `2x4`: Cyan (solid line)
- `2x3`: Magenta (solid line)
- `2x2`: Green (solid line)
- `2x1`: Red (solid line)
- `1x1`: Black (solid line)
- `BW peak`: Dashed black line at 240 Mstencil/s.
### Detailed Analysis
1. **2x4 (Cyan)**:
- Starts at ~185 Mstencil/s at input length 0.
- Peaks sharply at ~220 Mstencil/s near input length 20.
- Drops rapidly to ~100 Mstencil/s by input length 50.
- Stabilizes with minor fluctuations (~90–110 Mstencil/s) afterward.
2. **2x3 (Magenta)**:
- Begins at ~190 Mstencil/s.
- Peaks at ~210 Mstencil/s near input length 20.
- Declines to ~110 Mstencil/s by input length 50.
- Stabilizes with oscillations (~95–115 Mstencil/s).
3. **2x2 (Green)**:
- Initial value ~175 Mstencil/s.
- Peaks at ~200 Mstencil/s near input length 20.
- Drops to ~120 Mstencil/s by input length 50.
- Stabilizes with fluctuations (~100–125 Mstencil/s).
4. **2x1 (Red)**:
- Starts at ~160 Mstencil/s.
- Peaks at ~180 Mstencil/s near input length 20.
- Declines to ~120 Mstencil/s by input length 50.
- Stabilizes with minor variations (~110–125 Mstencil/s).
5. **1x1 (Black)**:
- Flat line at ~60 Mstencil/s across all input lengths.
6. **BW Peak (Dashed Black)**:
- Horizontal reference line at 240 Mstencil/s.
- No data series reaches this value.
### Key Observations
- **Initial Peak**: All BW multipliers exhibit a sharp performance spike near input length 20, followed by a rapid decline.
- **Stabilization**: After input length 50, performance stabilizes with minor oscillations for all multipliers except 1x1.
- **1x1 Baseline**: The 1x1 line remains constant, suggesting it represents a control or baseline condition.
- **BW Peak Unattained**: No configuration reaches the theoretical BW peak of 240 Mstencil/s.
### Interpretation
The graph demonstrates that higher BW multipliers (e.g., 2x4) achieve greater initial performance gains but experience rapid degradation as input length increases. The stabilization phase suggests diminishing returns or system saturation beyond input length 50. The unattained BW peak implies hardware or algorithmic limitations preventing optimal performance. The 1x1 line’s flatness indicates a consistent baseline, possibly representing a non-scaled or reference configuration. The sharp initial drop may reflect resource contention or inefficiencies at higher BW settings.