## Flow Diagram: Task Categorization and Color Change Rules
### Overview
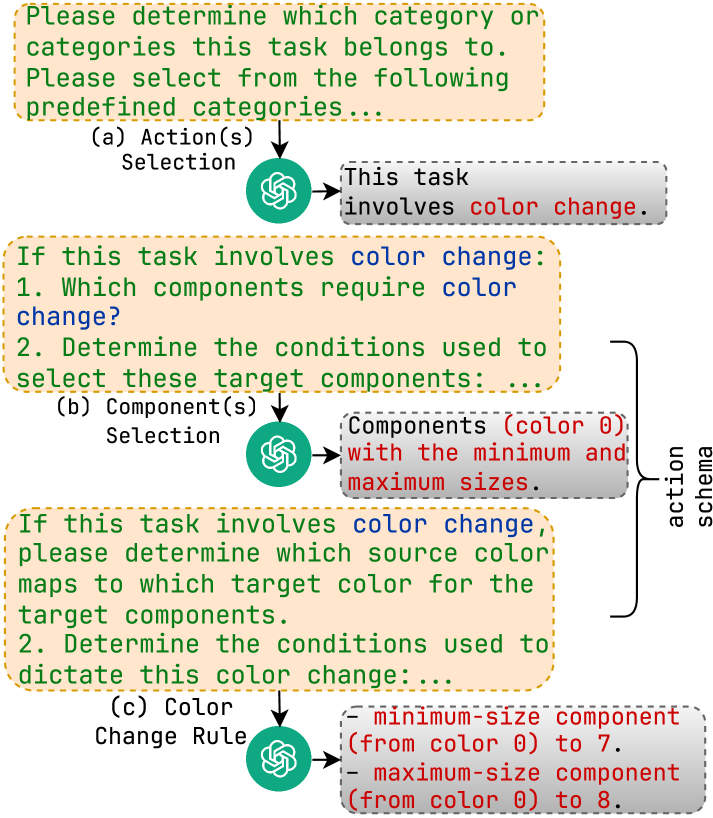
The image presents a flow diagram outlining a process for categorizing tasks, specifically focusing on tasks involving color changes. The diagram guides the user through a series of questions and selections to define the task's nature and the rules governing color modifications.
### Components/Axes
* **Nodes:** The diagram consists of rectangular nodes with rounded corners, containing instructions and questions. These nodes are outlined in a dashed orange line.
* **Flow Arrows:** Arrows indicate the flow of the process, directing the user from one node to the next.
* **ChatGPT Icons:** A green ChatGPT icon is present after each selection node.
* **Action Schema:** A vertical label on the right side of the diagram indicates the "action schema."
* **Selection Categories:** The diagram is divided into three main categories: (a) Action(s) Selection, (b) Component(s) Selection, and (c) Color Change Rule.
* **Color Coding:** The text "color 0" is colored red in the diagram.
### Detailed Analysis or ### Content Details
1. **Top Node:**
* Text: "Please determine which category or categories this task belongs to. Please select from the following predefined categories..."
* Category: (a) Action(s) Selection
2. **First Selection Node:**
* ChatGPT Icon
* Flows to: "This task involves color change." (gray box with dashed outline)
3. **Second Node:**
* Text: "If this task involves color change: 1. Which components require color change? 2. Determine the conditions used to select these target components:..."
* Category: (b) Component(s) Selection
4. **Second Selection Node:**
* ChatGPT Icon
* Flows to: "Components (color 0) with the minimum and maximum sizes." (gray box with dashed outline)
5. **Third Node:**
* Text: "If this task involves color change, please determine which source color maps to which target color for the target components. 2. Determine the conditions used to dictate this color change:..."
* Category: (c) Color Change Rule
6. **Third Selection Node:**
* ChatGPT Icon
* Flows to:
* "- minimum-size component (from color 0) to 7." (gray box with dashed outline)
* "- maximum-size component (from color 0) to 8." (gray box with dashed outline)
7. **Action Schema:**
* Vertical label on the right side of the diagram connecting the second and third selection nodes.
### Key Observations
* The diagram outlines a decision-making process for tasks involving color changes.
* The process is divided into three main categories: Action Selection, Component Selection, and Color Change Rule.
* The diagram uses ChatGPT icons to indicate selection points.
* The "action schema" label suggests a structured approach to defining actions related to color changes.
* The color "color 0" is specifically highlighted in red.
* The final step involves defining color changes for minimum and maximum size components, with the color changing from "color 0" to 7 and 8, respectively.
### Interpretation
The diagram provides a structured approach to categorizing and defining tasks that involve color changes. It guides the user through a series of questions and selections to determine the specific actions, components, and rules associated with the color modification. The use of "color 0" as a starting point suggests a baseline color from which changes are made. The final step focuses on defining color changes for components of different sizes, indicating that size is a relevant factor in the color change process. The "action schema" label implies a standardized framework for describing and implementing these color change actions.