\n
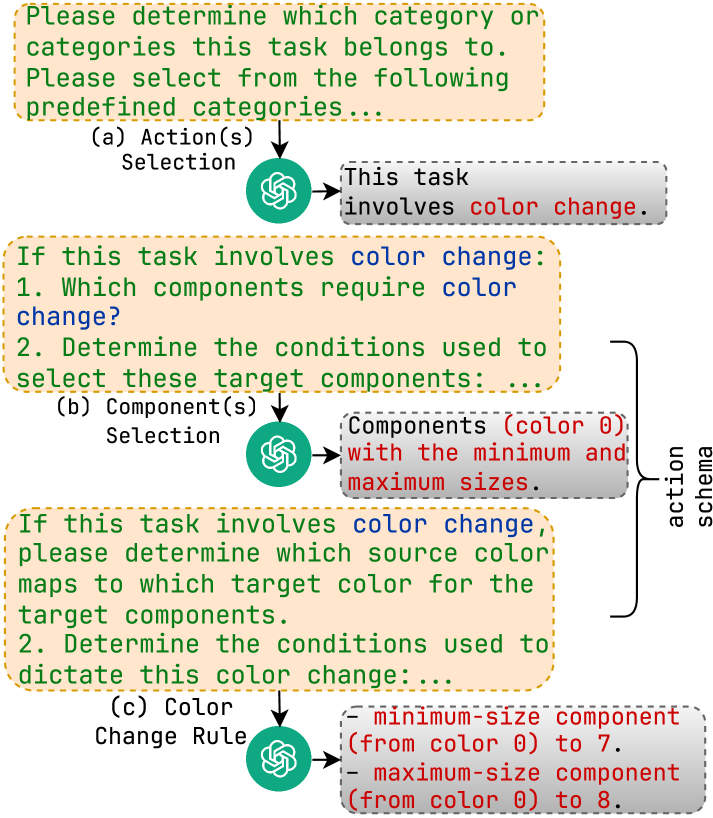
## Diagram: Task Categorization and Color Change Rules
### Overview
The image presents a flowchart-style diagram outlining a task categorization process, specifically focusing on tasks involving color change. It details the steps to determine the category of a task and, if it involves color change, the components affected and the rules governing the color transformation. The diagram is structured with branching paths based on task characteristics.
### Components/Axes
The diagram consists of three main categories:
* **(a) Action(s) Selection:** Leads to a check for color change involvement.
* **(b) Component(s) Selection:** Focuses on identifying components requiring color change.
* **(c) Color Change Rule:** Defines the rules for color transformation.
Each category has a corresponding green swirl icon. There are orange boxes containing descriptive text. A vertical text label on the right reads "action schema". The diagram uses arrows to indicate flow direction.
### Detailed Analysis or Content Details
**(a) Action(s) Selection:**
* Text: "Please determine which category or categories this task belongs to. Please select from the following predefined categories..."
* Text: "Selection"
* Arrow leads to a conditional check: "This task involves color change."
**(b) Component(s) Selection:**
* Text: "If this task involves color change: 1. Which components require color change? 2. Determine the conditions used to select these target components..."
* Text: "Selection"
* Text: "Components: (color 0) with the minimum and maximum sizes."
* Arrow leads to a conditional check: "If this task involves color change, please determine which source color maps to which target color for the target components. 2. Determine the conditions used to dictate this color change..."
**(c) Color Change Rule:**
* Text: "Color Change Rule"
* Text: "- minimum-size component (from color 0) to 7."
* Text: "- maximum-size component (from color 0) to 8."
### Key Observations
The diagram focuses on a specific type of task – those involving color changes. It breaks down the process into identifying the affected components and defining the rules for the color transformation. The color "0" appears to be a starting color for both minimum and maximum size components. The color change rules are specific: minimum-size components change from color 0 to color 7, and maximum-size components change from color 0 to color 8.
### Interpretation
This diagram represents a formalized process for handling tasks that involve altering the color of components within a system. It suggests a structured approach to ensure consistency and predictability in color changes. The categorization into Action, Component, and Color Change Rule indicates a modular design, allowing for independent modification of each aspect. The specific color change rules (0 to 7, 0 to 8) imply a defined color palette or scale is in use. The diagram is likely part of a larger system for defining and executing automated tasks or workflows, potentially within a user interface or a data visualization application. The "action schema" label suggests this is a formalized description of the actions that can be taken. The diagram is not presenting data, but rather a *process* for handling data.