## Bar Chart: Verified Accuracy With CI Across Similarity Thresholds - All Models
### Overview
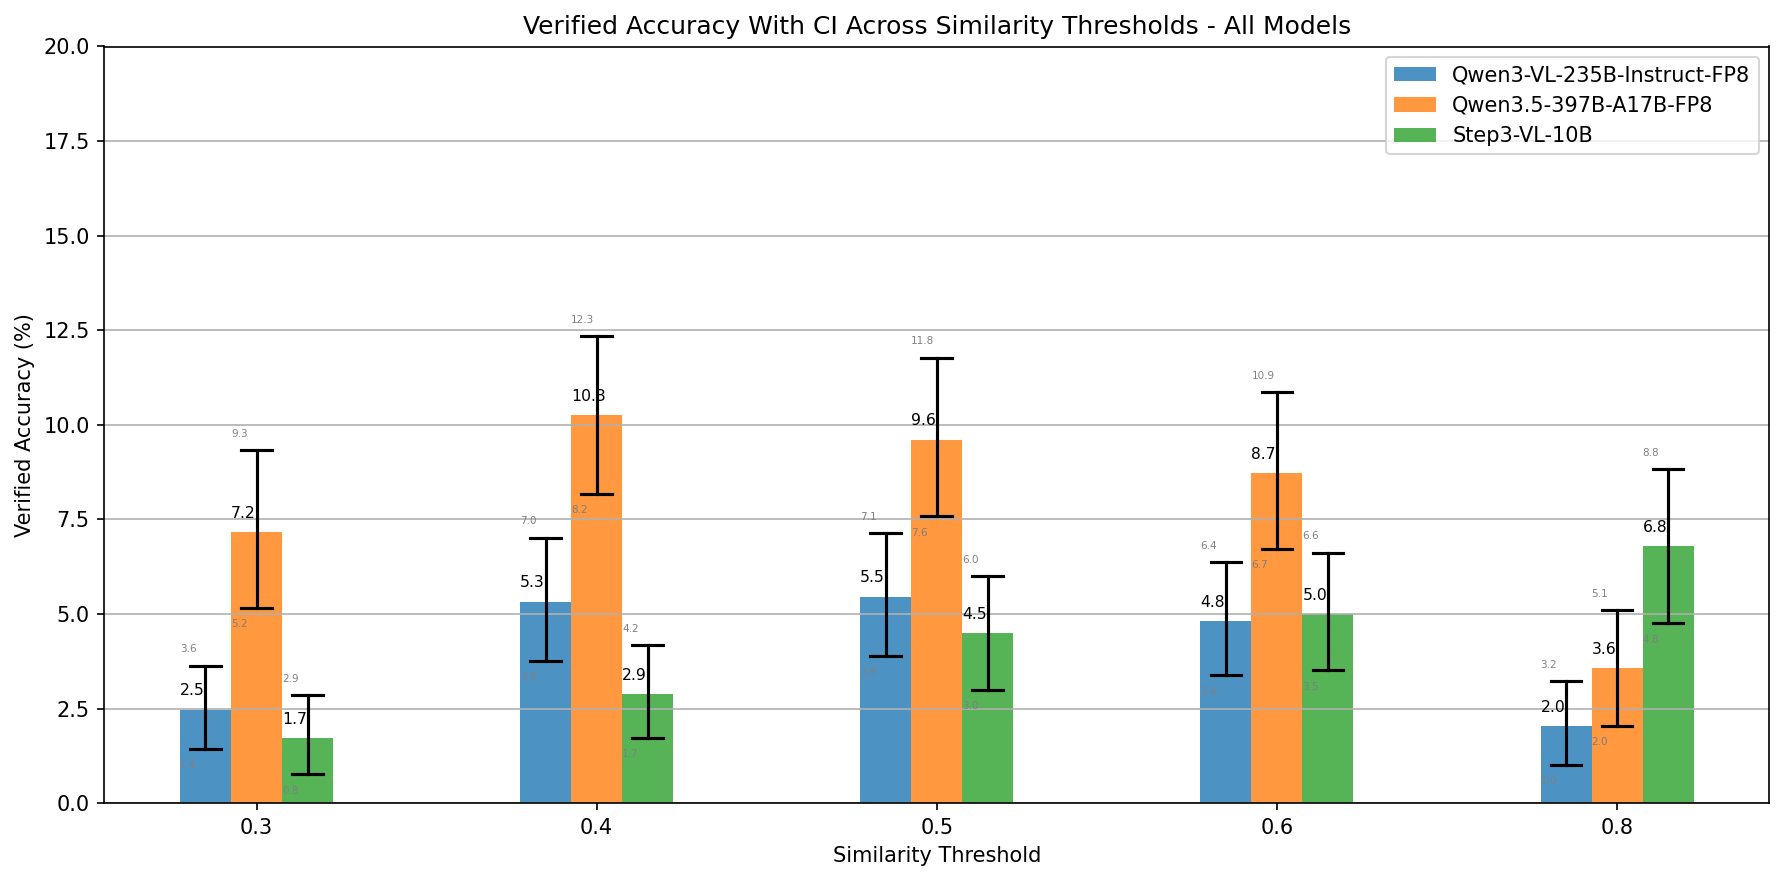
The chart compares verified accuracy percentages (with confidence intervals) for three AI models across five similarity thresholds (0.3, 0.4, 0.5, 0.6, 0.8). Models are color-coded: Qwen3-VL-235B-Instruct-FP8 (blue), Qwen3.5-397B-A17B-FP8 (orange), and Step3-VL-10B (green). Error bars represent confidence intervals.
### Components/Axes
- **X-axis**: Similarity Threshold (0.3, 0.4, 0.5, 0.6, 0.8)
- **Y-axis**: Verified Accuracy (%) (0–20 scale)
- **Legend**: Located in top-right corner, mapping colors to models
- **Error Bars**: Vertical black lines with numerical uncertainty values above each bar
### Detailed Analysis
1. **Threshold 0.3**:
- Qwen3-VL-235B: 2.5% (±0.6)
- Qwen3.5-397B: 7.2% (±1.7)
- Step3-VL-10B: 1.7% (±0.5)
2. **Threshold 0.4**:
- Qwen3-VL-235B: 5.3% (±1.4)
- Qwen3.5-397B: 10.3% (±2.3)
- Step3-VL-10B: 2.9% (±0.7)
3. **Threshold 0.5**:
- Qwen3-VL-235B: 5.5% (±1.4)
- Qwen3.5-397B: 9.6% (±1.7)
- Step3-VL-10B: 4.5% (±1.0)
4. **Threshold 0.6**:
- Qwen3-VL-235B: 4.8% (±1.4)
- Qwen3.5-397B: 8.7% (±1.6)
- Step3-VL-10B: 5.0% (±1.0)
5. **Threshold 0.8**:
- Qwen3-VL-235B: 2.0% (±0.6)
- Qwen3.5-397B: 3.6% (±1.2)
- Step3-VL-10B: 6.8% (±1.8)
### Key Observations
1. **Model Performance Trends**:
- Qwen3.5-397B consistently shows highest accuracy across all thresholds (range: 3.6–10.3%)
- Step3-VL-10B underperforms at lower thresholds but surpasses others at 0.8 (6.8%)
- Qwen3-VL-235B shows moderate performance with a notable drop at 0.8
2. **Error Margin Patterns**:
- Qwen3.5-397B has largest confidence intervals at 0.4 (±2.3)
- Step3-VL-10B exhibits increasing uncertainty at higher thresholds (0.8: ±1.8)
3. **Anomalies**:
- Step3-VL-10B's accuracy inversion at 0.8 (6.8%) vs. lower thresholds (max 5.0%)
- Qwen3-VL-235B's accuracy decline at 0.8 (-3.8% from 0.6)
### Interpretation
The data suggests:
1. **Threshold Sensitivity**: All models show reduced accuracy at extreme thresholds (0.3 and 0.8), with Step3-VL-10B uniquely improving at 0.8.
2. **Model Robustness**: Qwen3.5-397B demonstrates superior consistency but with higher variability at mid-thresholds (0.4–0.6).
3. **Potential Tradeoffs**: Step3-VL-10B's performance inversion at 0.8 may indicate specialized optimization for high-similarity tasks, while Qwen3-VL-235B's decline suggests overfitting to moderate similarity ranges.
The chart highlights the importance of threshold selection in model deployment, with Step3-VL-10B's unexpected performance at 0.8 warranting further investigation into its training data distribution.