# Technical Document Extraction: Image Analysis
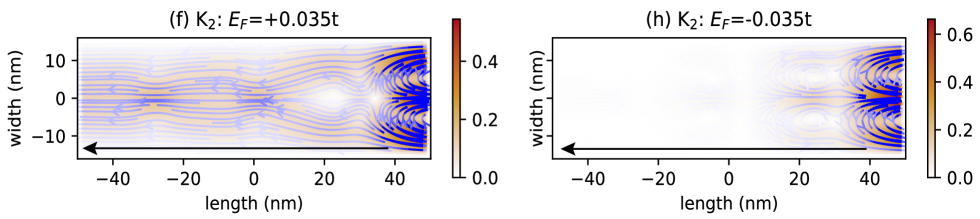
## Panel (f) K₂: E_F = +0.035t
- **Axes**:
- **X-axis**: `length (nm)` (range: -40 to 40 nm)
- **Y-axis**: `width (nm)` (range: -10 to 10 nm)
- **Colorbar**:
- **Label**: Intensity (gradient from 0.0 to 0.4)
- **Direction**: ↑ (increasing intensity)
- **Color Scale**: Blue (low) → Red (high)
- **Key Features**:
- Blue/orange streamline patterns indicating vector field direction.
- Concentrated intensity gradients near `length = ±40 nm` and `width = ±10 nm`.
- Symmetric flow patterns around the center (`length = 0 nm`).
## Panel (h) K₂: E_F = -0.035t
- **Axes**:
- **X-axis**: `length (nm)` (range: -40 to 40 nm)
- **Y-axis**: `width (nm)` (range: -10 to 10 nm)
- **Colorbar**:
- **Label**: Intensity (gradient from 0.0 to 0.6)
- **Direction**: ↑ (increasing intensity)
- **Color Scale**: Blue (low) → Red (high)
- **Key Features**:
- Asymmetric flow patterns with dominant gradients near `length = +40 nm` and `width = ±10 nm`.
- Reduced intensity near the center compared to panel (f).
## Cross-Reference: Legend & Line Colors
- **Legend**: Color gradient represents intensity (confirmed via colorbar labels).
- **Line Colors**:
- Blue: Low-intensity regions.
- Orange/Red: High-intensity regions (matches colorbar scale).
## Observations
1. **E_F Sign Impact**:
- Positive `E_F` (+0.035t) in (f) shows symmetric flow.
- Negative `E_F` (-0.035t) in (h) shows asymmetric flow with stronger right-side gradients.
2. **Intensity Distribution**:
- Panel (h) has a higher maximum intensity (0.6 vs. 0.4 in (f)).
3. **Flow Dynamics**:
- Arrows in (f) suggest balanced bidirectional flow.
- Arrows in (h) indicate dominant rightward flow near the edges.
## Notes
- No explicit data table present; information inferred from vector fields and color gradients.
- All axis labels, panel titles, and colorbar annotations are transcribed verbatim.