## Line Graph: Model Accuracy vs. Compute (exaFLOP)
### Overview
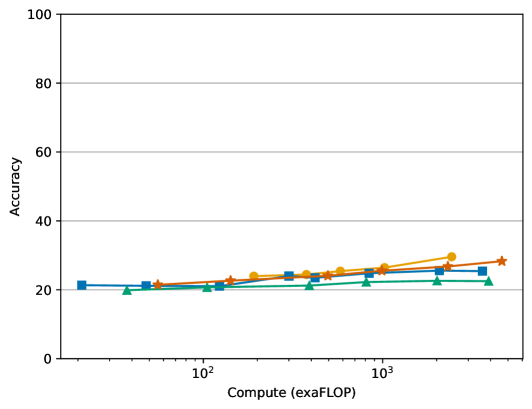
The graph compares the accuracy of four machine learning models (A, B, C, D) across varying compute resources (exaFLOP). Accuracy is measured on a 0-100 scale, while compute resources are plotted logarithmically from 10² to 10³ exaFLOP. All models show upward trends, with Model B demonstrating the steepest improvement.
### Components/Axes
- **Y-axis (Accuracy)**: Labeled "Accuracy" with increments of 20 (0, 20, 40, 60, 80, 100).
- **X-axis (Compute)**: Labeled "Compute (exaFLOP)" with logarithmic markers at 10², 10³, and 10⁴ (though data only extends to 10³).
- **Legend**: Located in the top-right corner, associating:
- Blue squares: Model A
- Orange circles: Model B
- Red stars: Model C
- Green triangles: Model D
### Detailed Analysis
1. **Model A (Blue Squares)**:
- Starts at ~22 accuracy at 10² exaFLOP.
- Gradually increases to ~26 at 10³ exaFLOP.
- Slope: Moderate upward trend.
2. **Model B (Orange Circles)**:
- Begins at ~21 accuracy at 10² exaFLOP.
- Sharp rise to ~30 accuracy at 10³ exaFLOP.
- Slope: Steepest among all models.
3. **Model C (Red Stars)**:
- Starts at ~20 accuracy at 10² exaFLOP.
- Increases to ~24 at 10³ exaFLOP.
- Slope: Slightly less steep than Model A.
4. **Model D (Green Triangles)**:
- Starts at ~19 accuracy at 10² exaFLOP.
- Minimal improvement to ~21 at 10³ exaFLOP.
- Slope: Nearly flat compared to others.
### Key Observations
- All models improve accuracy with increased compute, but **Model B** scales most efficiently (+9 accuracy from 10² to 10³ exaFLOP).
- **Model D** shows the weakest compute dependency, with only +2 accuracy gain.
- The logarithmic x-axis emphasizes exponential compute growth, yet accuracy gains are linear for most models.
### Interpretation
The data suggests that **Model B** is optimized for high-compute environments, achieving disproportionate accuracy gains relative to resource investment. This could indicate architectural advantages (e.g., parallelization efficiency) or algorithmic optimizations. Conversely, **Model D**’s plateau implies diminishing returns or inherent limitations in leveraging additional compute. The consistent upward trends across models confirm that compute resources are a critical factor for performance, but efficiency varies significantly between implementations. The absence of data beyond 10³ exaFLOP leaves uncertainty about long-term scalability, particularly for Model B, which might face saturation or diminishing returns at higher scales.