## Line Chart: Q*_w vs Alpha
### Overview
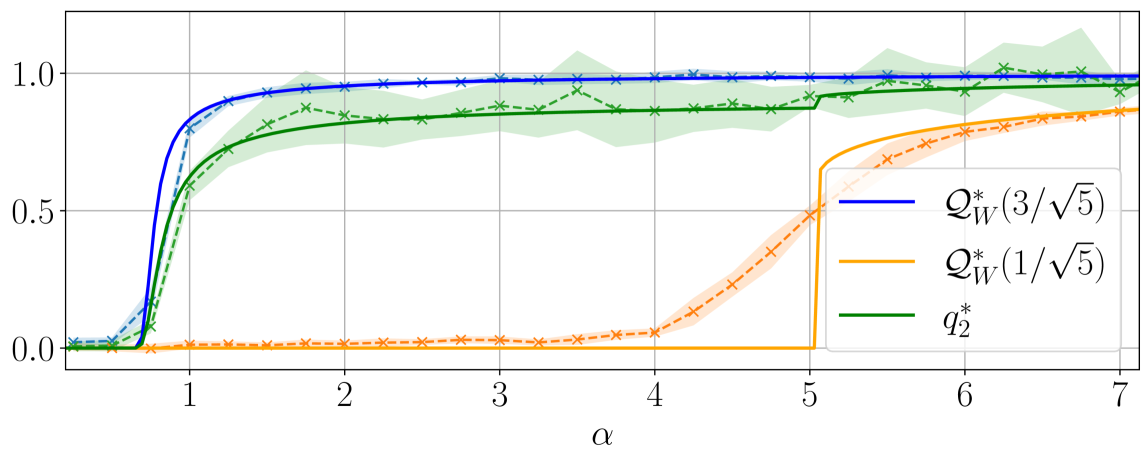
The image is a line chart comparing three different data series, Q*_w(3/√5), Q*_w(1/√5), and q*_2, as a function of alpha (α). The chart shows how these values change as alpha increases from approximately 0 to 7. The plot includes shaded regions around the dashed lines, indicating uncertainty or variance in the data.
### Components/Axes
* **X-axis (Horizontal):**
* Label: α (alpha)
* Scale: 0 to 7, with tick marks at every integer value.
* **Y-axis (Vertical):**
* Scale: 0.0 to 1.0, with tick marks at 0.0, 0.5, and 1.0.
* **Legend (Right Side):**
* Blue line: Q*_w(3/√5)
* Orange line: Q*_w(1/√5)
* Green line: q*_2*
### Detailed Analysis
* **Q*_w(3/√5) (Blue):**
* Solid blue line with 'x' markers.
* Trend: Starts near 0 at α=0, rapidly increases to approximately 0.9 around α=1, and then plateaus around 1.0 for α > 1.
* Data Points:
* α = 0: Q*_w(3/√5) ≈ 0
* α = 1: Q*_w(3/√5) ≈ 0.9
* α = 7: Q*_w(3/√5) ≈ 1.0
* **Q*_w(1/√5) (Orange):**
* Dashed orange line with '+' markers. Shaded region around the line indicates uncertainty.
* Trend: Remains near 0 until α=5, then rapidly increases to approximately 0.85.
* Data Points:
* α = 0: Q*_w(1/√5) ≈ 0
* α = 5: Q*_w(1/√5) ≈ 0
* α = 6: Q*_w(1/√5) ≈ 0.7
* α = 7: Q*_w(1/√5) ≈ 0.85
* **q*_2* (Green):**
* Solid green line with 'x' markers. Shaded region around the line indicates uncertainty.
* Trend: Starts near 0 at α=0, rapidly increases to approximately 0.7 around α=1, and then plateaus around 0.9 for α > 1. There is a slight dip around α=5.
* Data Points:
* α = 0: q*_2* ≈ 0
* α = 1: q*_2* ≈ 0.7
* α = 5: q*_2* ≈ 0.9
* α = 7: q*_2* ≈ 0.95
### Key Observations
* Q*_w(3/√5) and q*_2* exhibit a similar trend, rapidly increasing around α=1 and then plateauing.
* Q*_w(1/√5) remains near zero until α=5, after which it rapidly increases.
* The shaded regions around the dashed lines indicate the variability or uncertainty in the data.
### Interpretation
The chart illustrates how the values of Q*_w(3/√5), Q*_w(1/√5), and q*_2* change with respect to α. The data suggests that Q*_w(3/√5) and q*_2* are strongly influenced by α around α=1, while Q*_w(1/√5) is significantly affected only after α reaches 5. This could indicate different thresholds or critical points for these parameters in the underlying system being modeled. The shaded regions highlight the uncertainty associated with the dashed lines, suggesting that the solid lines are more stable or have less variability.