## Line Graph: Response Functions vs. Parameter α
### Overview
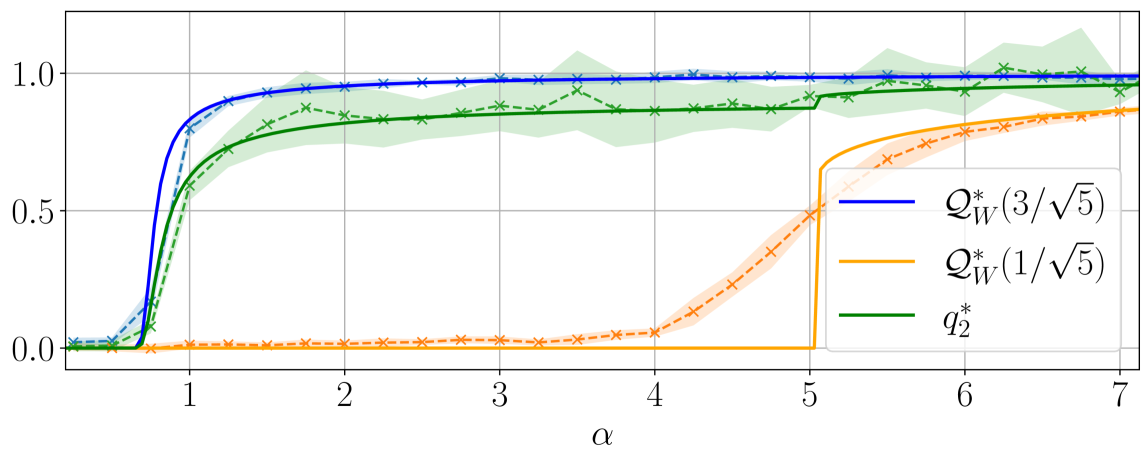
The graph depicts three response functions (Q*_W(3/√5), Q*_W(1/√5), and q*_2) plotted against a parameter α (0–7). All functions exhibit sigmoidal-like behavior with varying thresholds and saturation points. The blue line (Q*_W(3/√5)) saturates fastest, while the orange line (Q*_W(1/√5)) shows the slowest response.
### Components/Axes
- **X-axis (α)**: Horizontal axis labeled α, ranging from 0 to 7 in integer increments.
- **Y-axis**: Vertical axis labeled with values from 0.0 to 1.0 in 0.1 increments.
- **Legend**: Positioned in the bottom-right corner, with three entries:
- **Blue solid line**: Q*_W(3/√5)
- **Orange dashed line**: Q*_W(1/√5)
- **Green dotted line**: q*_2
### Detailed Analysis
1. **Q*_W(3/√5) (Blue Solid Line)**:
- Rises sharply from 0 to 1 between α=0 and α=1.
- Maintains a value of 1.0 for α ≥ 1.
- No visible uncertainty (solid line with no shaded region).
2. **Q*_W(1/√5) (Orange Dashed Line)**:
- Gradual ascent from 0 to ~0.8 between α=0 and α=7.
- Reaches ~0.8 at α=7, with a steep slope between α=5 and α=7.
- Shaded orange region indicates uncertainty, peaking at α=5–6.
3. **q*_2 (Green Dotted Line)**:
- Rapid rise to 1.0 between α=0 and α=1.
- Dips slightly below 1.0 (~0.95) between α=4 and α=6.
- Shaded green region shows uncertainty, peaking at α=3–5.
### Key Observations
- **Threshold Behavior**: Q*_W(3/√5) achieves maximum response (1.0) at the lowest α value (~1), while Q*_W(1/√5) requires α ≥ 5 to approach saturation.
- **Uncertainty Patterns**:
- Q*_W(1/√5) shows the largest uncertainty (shaded region width) between α=5–7.
- q*_2 exhibits uncertainty primarily between α=2–5.
- **Phase Transitions**:
- All functions transition from 0 to 1 between α=0–2.
- q*_2 shows a secondary dip between α=4–6, suggesting a stabilization phase.
### Interpretation
The graph illustrates parameter-dependent response thresholds for three functions. The blue line (Q*_W(3/√5)) represents the most sensitive system, achieving full response at α=1. The orange line (Q*_W(1/√5)) demonstrates a delayed response, requiring higher α values to approach saturation, with increasing uncertainty at higher α. The green line (q*_2) exhibits bistable behavior, peaking early but showing reduced confidence (dip and uncertainty) at intermediate α values. This could indicate competing mechanisms or hysteresis effects in the system being modeled. The shaded regions suggest measurement noise or model uncertainty, with Q*_W(1/√5) being the least predictable at higher α values.