## Flowchart: Collaborative Process for Agent Cooperation
### Overview
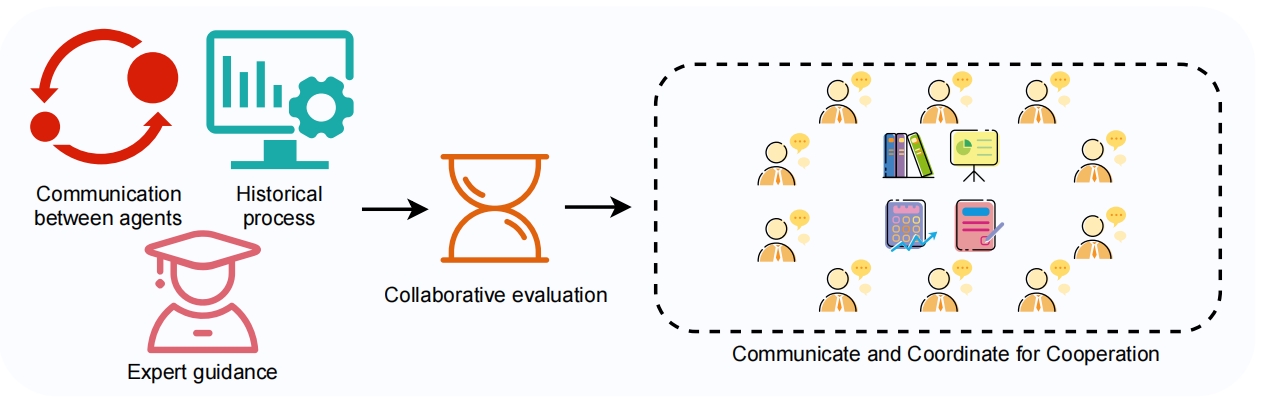
The image depicts a structured workflow for achieving cooperation among agents, visualized as a left-to-right flowchart with interconnected components. The process emphasizes communication, historical analysis, expert input, and collaborative evaluation leading to coordinated action.
### Components/Axes
1. **Left Section (Input Components):**
- **Red Circular Arrow**: Labeled "Communication between agents" (top-left).
- **Teal Computer Monitor**: Contains a gear icon and bar graph, labeled "Historical process" (top-center).
- **Red Graduation Cap Icon**: Labeled "Expert guidance" (bottom-left).
2. **Central Element:**
- **Orange Hourglass**: Labeled "Collaborative evaluation," acting as a bridge between input components and the final output.
3. **Right Section (Output Component):**
- **Dashed Box**: Contains:
- **Eight Stick Figures**: Arranged in a circular pattern with speech bubbles (representing agents).
- **Central Icons**: Books, pie chart, calculator, and notebook (symbolizing tools/resources).
- **Text Overlay**: "Communicate and Coordinate for Cooperation" (bottom-right).
### Detailed Analysis
- **Flow Direction**: Left-to-right progression from input components (communication, historical data, expert guidance) to collaborative evaluation (hourglass) and final output (cooperation).
- **Input Components**:
- **Communication**: Cyclical arrows suggest iterative interaction.
- **Historical Process**: Bar graph implies data-driven analysis.
- **Expert Guidance**: Symbolizes human oversight or domain expertise.
- **Collaborative Evaluation**: Hourglass signifies time-bound deliberation or iterative refinement.
- **Output Component**: Dashed box represents a collective framework for agents to interact, share resources, and align goals.
### Key Observations
- **Cyclical Communication**: The red arrow emphasizes continuous interaction among agents.
- **Resource Integration**: Central icons (books, calculator, etc.) suggest multidisciplinary collaboration.
- **Agent Roles**: Stick figures with speech bubbles highlight active participation in dialogue.
### Interpretation
The flowchart illustrates a systemic approach to fostering cooperation among agents by integrating:
1. **Dynamic Communication**: Ensuring ongoing dialogue to align objectives.
2. **Data-Driven Insights**: Leveraging historical processes for informed decisions.
3. **Expert Oversight**: Incorporating specialized knowledge to guide evaluations.
4. **Collaborative Frameworks**: Structuring interactions to optimize resource sharing and goal alignment.
The absence of numerical data suggests this is a conceptual model rather than a quantitative analysis. The emphasis on cyclical communication and resource integration implies that cooperation is an iterative, resource-dependent process requiring both human and technical inputs.