## Bar Chart: Leaderboard on MathVista
### Overview
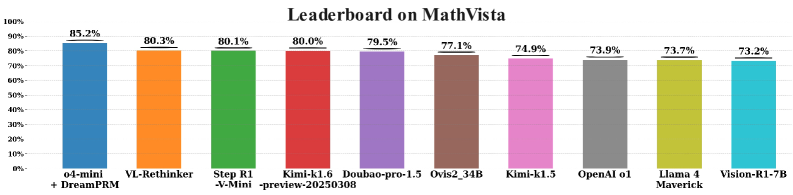
The image is a bar chart displaying a leaderboard of different models on MathVista. The y-axis represents a percentage score, ranging from 0% to 100%. The x-axis lists the names of the models. Each bar represents the score of a specific model.
### Components/Axes
* **Title:** Leaderboard on MathVista
* **Y-axis:**
* Label: (Implied Percentage)
* Scale: 0%, 10%, 20%, 30%, 40%, 50%, 60%, 70%, 80%, 90%, 100%
* **X-axis:**
* Labels (Model Names, from left to right):
* o4-mini + DreamPRM
* VL-Rethinker
* Step R1 -V-Mini
* Kimi-k1.6 -preview-20250308
* Doubao-pro-1.5
* Ovis2\_34B
* Kimi-k1.5
* OpenAI o1
* Llama 4 Maverick
* Vision-R1-7B
### Detailed Analysis
* **o4-mini + DreamPRM:** Blue bar, score of 85.2%
* **VL-Rethinker:** Orange bar, score of 80.3%
* **Step R1 -V-Mini:** Green bar, score of 80.1%
* **Kimi-k1.6 -preview-20250308:** Red bar, score of 80.0%
* **Doubao-pro-1.5:** Purple bar, score of 79.5%
* **Ovis2\_34B:** Brown bar, score of 77.1%
* **Kimi-k1.5:** Pink bar, score of 74.9%
* **OpenAI o1:** Gray bar, score of 73.9%
* **Llama 4 Maverick:** Yellow-Green bar, score of 73.7%
* **Vision-R1-7B:** Cyan bar, score of 73.2%
### Key Observations
* The model "o4-mini + DreamPRM" has the highest score at 85.2%.
* The scores range from 73.2% to 85.2%.
* There is a relatively small difference in scores between the models, with most scores clustered between 73% and 80%.
### Interpretation
The bar chart presents a performance comparison of different models on the MathVista benchmark. "o4-mini + DreamPRM" outperforms the other models, while "Vision-R1-7B" has the lowest score among the listed models. The close proximity of the scores suggests that the models are relatively competitive on this particular benchmark. The chart provides a snapshot of the relative performance of these models, which can be useful for model selection or further research and development.