## Bar Chart: Leaderboard on MathVista
### Overview
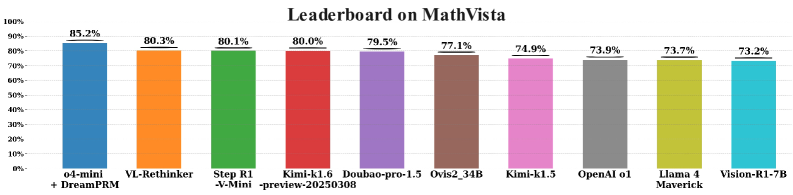
The chart displays a horizontal bar comparison of model performance on the MathVista benchmark. Each bar represents a different AI model's accuracy percentage, with the highest-performing model at the top and the lowest at the bottom. The chart uses distinct colors for each model to differentiate results.
### Components/Axes
- **X-Axis**: Model names (e.g., "o4-mini + DreamPRM", "VL-Rethinker", "Step R1 -V-Mini", etc.)
- **Y-Axis**: Accuracy percentages (0% to 100% in 10% increments)
- **Legend**: Integrated via bar colors (no separate legend box). Colors correspond to model names in left-to-right order.
- **Title**: "Leaderboard on MathVista" (centered at the top)
### Detailed Analysis
1. **o4-mini + DreamPRM** (Blue): 85.2% (highest)
2. **VL-Rethinker** (Orange): 80.3%
3. **Step R1 -V-Mini** (Green): 80.1%
4. **Kimi-k1.6 -preview-20250308** (Red): 80.0%
5. **Doubao-pro-1.5** (Purple): 79.5%
6. **Ovis2_34B** (Brown): 77.1%
7. **Kimi-k1.5** (Pink): 74.9%
8. **OpenAI o1** (Gray): 73.9%
9. **Llama 4 Maverick** (Olive): 73.7%
10. **Vision-R1-7B** (Cyan): 73.2% (lowest)
### Key Observations
- **Dominance of o4-mini + DreamPRM**: The top model outperforms all others by 5.1 percentage points.
- **Tight Competition in Mid-Range**: Models 2–5 (VL-Rethinker to Kimi-k1.6) are clustered within 0.3 percentage points.
- **Gradual Decline**: Performance drops steadily from 85.2% to 73.2%, with the largest gap between the top model and the rest.
- **Color Consistency**: Each model’s bar color matches its position in the x-axis list without overlap.
### Interpretation
The data suggests **o4-mini + DreamPRM** is the current state-of-the-art for MathVista, likely due to specialized training or architecture optimizations. The mid-range cluster (79.5–80.3%) indicates a competitive field of high-performing models, while the bottom 3 models (73.2–73.9%) show minimal differentiation, possibly reflecting similar capabilities or niche limitations. The chart highlights the importance of incremental improvements in AI benchmarks, where small percentage gains can signify significant technical advancements. The absence of a separate legend implies the chart assumes viewers can directly associate colors with model names via their x-axis order.