## Heatmap: Average Jensen-Shannon Divergence Across Model Layers
### Overview
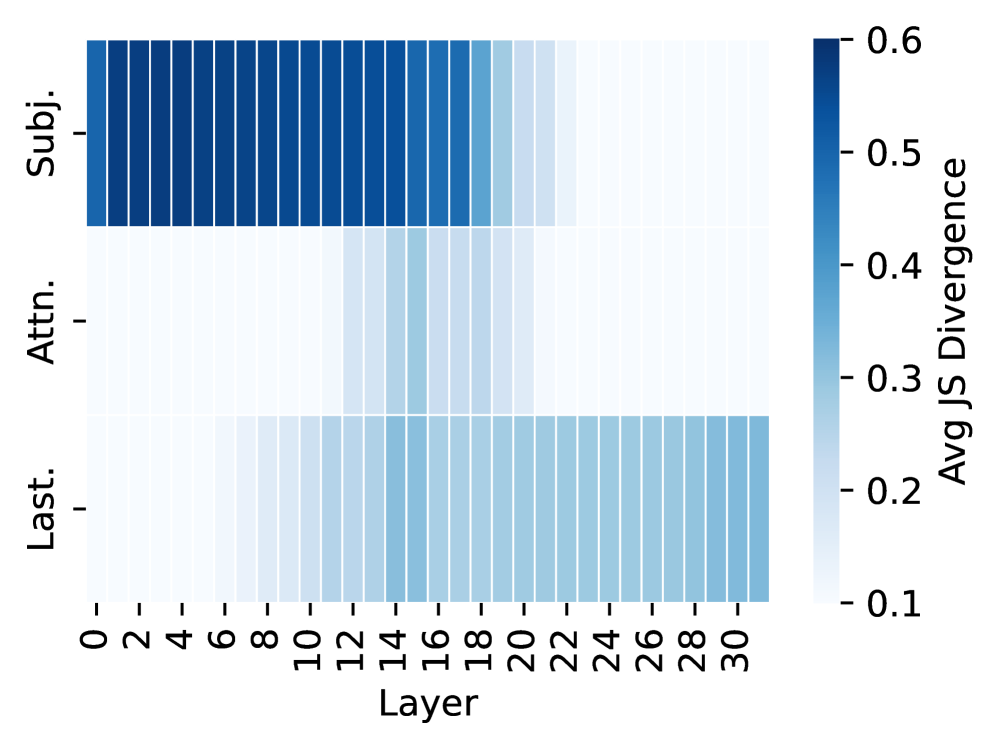
The image is a heatmap visualizing the average Jensen-Shannon (JS) Divergence across 31 layers (0-30) of a model for three distinct categories or components. The divergence is represented by a color gradient, with darker blues indicating higher divergence values. The chart is designed to compare how the divergence metric evolves across model depth for different aspects of the model's processing.
### Components/Axes
* **Y-Axis (Vertical):** Lists three categorical components. From top to bottom:
* `Subj.` (likely "Subject")
* `Attn.` (likely "Attention")
* `Last.` (likely "Last" or "Final" layer representation)
* **X-Axis (Horizontal):** Labeled "Layer". It displays discrete layer numbers from 0 to 30, with tick marks at every even number (0, 2, 4, ..., 30).
* **Color Bar (Legend):** Located on the right side of the chart.
* **Title:** "Avg JS Divergence"
* **Scale:** A continuous vertical gradient from light blue/white at the bottom to dark blue at the top.
* **Labeled Ticks:** 0.1, 0.2, 0.3, 0.4, 0.5, 0.6. The gradient suggests values can exist between these ticks.
### Detailed Analysis
The heatmap is a grid where each cell's color corresponds to the average JS Divergence for a specific component at a specific layer. The following analysis is based on visual estimation of color intensity against the provided scale.
**1. "Subj." Row (Top Row):**
* **Trend:** Starts with very high divergence in the earliest layers, which gradually decreases and then drops off sharply in the later layers.
* **Data Points (Estimated):**
* Layers 0-10: Very dark blue, indicating divergence values between **~0.55 and 0.6**.
* Layers 11-18: Medium to dark blue, showing a gradual decline from **~0.5 to ~0.4**.
* Layers 19-22: Light blue, indicating a rapid drop to **~0.2 to 0.15**.
* Layers 23-30: Very light blue/white, indicating divergence at or below **~0.1**.
**2. "Attn." Row (Middle Row):**
* **Trend:** Shows consistently low divergence across all layers, with a very slight, localized increase in the middle layers.
* **Data Points (Estimated):**
* Layers 0-10: Very light blue/white, indicating divergence at or below **~0.1**.
* Layers 11-20: Light blue, showing a slight increase to approximately **~0.15 to 0.2**.
* Layers 21-30: Returns to very light blue/white, indicating divergence at or below **~0.1**.
**3. "Last." Row (Bottom Row):**
* **Trend:** Shows a steady, monotonic increase in divergence from the first layer to the last.
* **Data Points (Estimated):**
* Layers 0-6: Very light blue/white, indicating divergence at or below **~0.1**.
* Layers 7-14: Light blue, showing a gradual increase from **~0.1 to ~0.2**.
* Layers 15-22: Medium blue, indicating values from **~0.2 to ~0.3**.
* Layers 23-30: Medium-dark blue, showing a continued rise to approximately **~0.35**.
### Key Observations
1. **Divergent Patterns:** The three components exhibit fundamentally different divergence profiles across the model's depth. "Subj." is high-then-low, "Attn." is consistently low, and "Last." is low-then-high.
2. **"Subj." Dominance in Early Layers:** The highest divergence values in the entire chart are found in the "Subj." component within the first ~10 layers.
3. **"Attn." Stability:** The attention mechanism ("Attn.") shows the least variation and the lowest overall divergence, suggesting its internal representations are relatively stable or consistent across layers as measured by JS Divergence.
4. **"Last." Accumulation:** The "Last." component shows a clear pattern of accumulating divergence as information propagates through the network layers.
### Interpretation
This heatmap likely analyzes the internal dynamics of a deep neural network, possibly a transformer model given the "Attn." label. Jensen-Shannon Divergence measures the similarity between two probability distributions. Here, it is probably comparing the distribution of activations or attention patterns at each layer to some reference distribution (e.g., the distribution at the final layer, or across different inputs).
* **"Subj." (Subject):** The high early-layer divergence suggests that the model's initial processing of subject-related information is highly variable or distinct from its later, more refined representations. The sharp drop indicates this information becomes consolidated or standardized in deeper layers.
* **"Attn." (Attention):** The consistently low divergence implies that the fundamental patterns of how the model attends to different parts of the input remain relatively constant throughout its depth. The minor bump in middle layers could indicate a phase of subtle reweighting.
* **"Last." (Final Representation):** The steadily increasing divergence suggests that the model's high-level, integrated representations become progressively more distinct or specialized layer by layer, moving away from the initial, more generic input representation.
**Overall Implication:** The chart reveals a functional specialization across the network's depth. Early layers are highly active in processing and differentiating core semantic elements ("Subj."), middle layers maintain stable attention mechanisms ("Attn."), and deeper layers progressively build unique, complex representations ("Last."). This pattern is consistent with the understanding of deep networks learning hierarchical features.