# Technical Document Extraction: Heatmap Analysis of JS Divergence
## 1. Image Classification and Overview
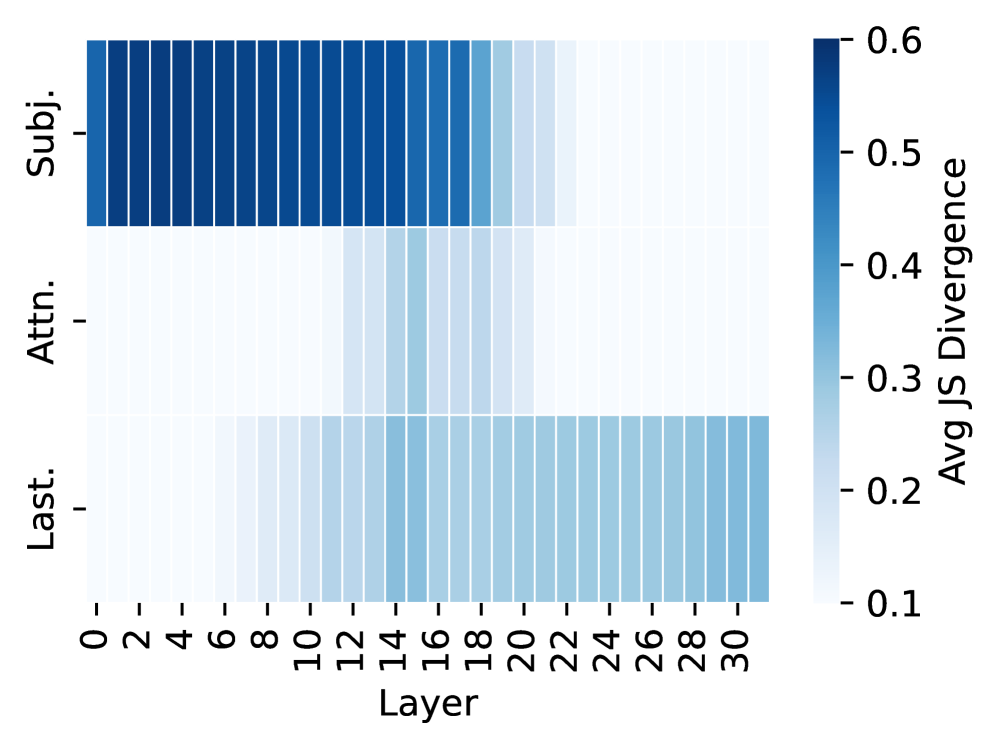
This image is a **heatmap** visualizing the "Avg JS Divergence" (Average Jensen-Shannon Divergence) across different layers of a neural network model. The data is categorized by three distinct components or stages of the model across 32 layers.
## 2. Component Isolation
### A. Header / Legend (Right Side)
* **Type:** Vertical Color Scale (Legend)
* **Label:** "Avg JS Divergence"
* **Scale Range:** 0.1 to 0.6
* **Color Gradient:** Light blue/white (low divergence, ~0.1) to dark navy blue (high divergence, ~0.6).
* **Spatial Grounding:** Located on the far right of the image.
### B. Main Chart (Center)
* **X-Axis Label:** "Layer"
* **X-Axis Markers:** 0, 2, 4, 6, 8, 10, 12, 14, 16, 18, 20, 22, 24, 26, 28, 30 (Total of 32 columns represented).
* **Y-Axis Labels (Categories):**
1. **Subj.** (Top row)
2. **Attn.** (Middle row)
3. **Last.** (Bottom row)
## 3. Data Extraction and Trend Verification
### Row 1: "Subj." (Subject)
* **Visual Trend:** High divergence (dark blue) in the early to middle layers, followed by a sharp drop-off to very low divergence (white) in the later layers.
* **Detailed Data Points:**
* **Layers 0–17:** Consistently high divergence, appearing at the maximum scale value of approximately **0.5 to 0.6**.
* **Layer 18:** Moderate divergence (~0.4).
* **Layers 19–21:** Light blue, indicating a transition (~0.2 to 0.3).
* **Layers 22–31:** Very low divergence, appearing near the minimum scale value of **0.1**.
### Row 2: "Attn." (Attention)
* **Visual Trend:** Consistently low divergence across almost all layers, with a very slight, subtle increase in the middle layers.
* **Detailed Data Points:**
* **Layers 0–13:** Near-minimum divergence (~0.1).
* **Layers 14–17:** Very slight increase to a pale blue (~0.15 to 0.2).
* **Layers 18–31:** Returns to near-minimum divergence (~0.1).
### Row 3: "Last." (Last/Final)
* **Visual Trend:** Low divergence in early layers, gradually increasing and stabilizing at a moderate level in the latter half of the model.
* **Detailed Data Points:**
* **Layers 0–7:** Very low divergence (~0.1).
* **Layers 8–14:** Gradual upward slope in divergence (transitioning from white to light blue).
* **Layers 15–31:** Stabilizes at a moderate divergence level, appearing to be approximately **0.3 to 0.35** on the color scale.
## 4. Summary Table of Extracted Data
| Category | Layers 0-10 | Layers 11-20 | Layers 21-31 |
| :--- | :--- | :--- | :--- |
| **Subj.** | High (~0.6) | High to Moderate Drop | Very Low (~0.1) |
| **Attn.** | Very Low (~0.1) | Low (~0.15) | Very Low (~0.1) |
| **Last.** | Very Low (~0.1) | Moderate Increase | Moderate (~0.35) |
## 5. Technical Observations
The heatmap indicates that the "Subj." component is most active/divergent in the initial stages of the model, whereas the "Last." component gains divergence as the data progresses through the layers. The "Attn." component maintains the lowest JS Divergence throughout the entire architecture relative to the other two categories.