\n
## Heatmap: JS Divergence by Layer and Subject
### Overview
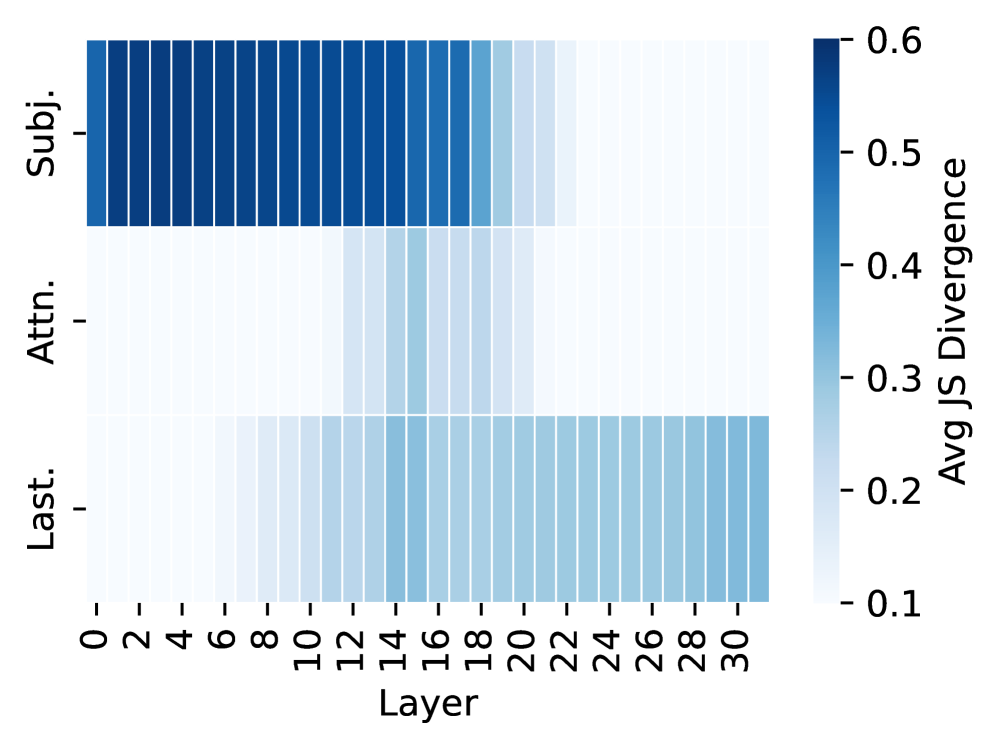
The image presents a heatmap visualizing the average Jensen-Shannon (JS) Divergence across different layers of a model, categorized by subject (Subj.), attention (Attn.), and last layer (Last.). The heatmap displays the divergence values using a color gradient, ranging from dark blue (high divergence) to light blue (low divergence).
### Components/Axes
* **X-axis:** Layer, ranging from 0 to 30, with increments of 2.
* **Y-axis:** Categories: "Subj." (Subject), "Attn." (Attention), and "Last." (Last Layer).
* **Color Scale:** Represents "Avg JS Divergence", ranging from 0.1 to 0.6. The scale is positioned on the right side of the heatmap.
* **Legend:** Located in the top-right corner, indicating the mapping between color and JS Divergence values.
### Detailed Analysis
The heatmap is structured into three horizontal bands, each representing one of the categories (Subj., Attn., Last.). Each cell in the heatmap represents the average JS Divergence for a specific layer and category.
**Subject (Subj.):**
* The JS Divergence is consistently high (approximately 0.55-0.6) for layers 0 to 10.
* From layer 10 to 14, the divergence decreases to approximately 0.45-0.5.
* From layer 14 to 30, the divergence continues to decrease, reaching approximately 0.2-0.3.
* Trend: A clear downward trend in JS Divergence as the layer number increases.
**Attention (Attn.):**
* The JS Divergence starts at approximately 0.35-0.4 for layers 0 to 6.
* From layer 6 to 16, the divergence remains relatively stable, around 0.4.
* From layer 16 to 30, the divergence gradually decreases to approximately 0.25-0.3.
* Trend: A slight downward trend in JS Divergence, with a plateau between layers 6 and 16.
**Last Layer (Last.):**
* The JS Divergence is low (approximately 0.1-0.2) for layers 0 to 10.
* From layer 10 to 16, the divergence increases to approximately 0.25-0.3.
* From layer 16 to 30, the divergence remains relatively stable, around 0.3.
* Trend: An upward trend in JS Divergence from layers 0 to 16, followed by stabilization.
### Key Observations
* The "Subject" category consistently exhibits the highest JS Divergence values across most layers.
* The "Last Layer" category consistently exhibits the lowest JS Divergence values across most layers.
* The "Attention" category shows intermediate JS Divergence values, with a relatively stable pattern.
* All three categories demonstrate a general trend of decreasing JS Divergence as the layer number increases, although the rate of decrease varies.
### Interpretation
This heatmap likely represents the analysis of internal representations learned by a neural network model. The JS Divergence measures the dissimilarity between probability distributions, in this case, likely the distributions of activations within each layer.
* **High JS Divergence (dark blue):** Indicates that the representations in that layer are significantly different from a baseline or expected distribution. This could suggest that the layer is learning distinct features or that the model is uncertain about its predictions.
* **Low JS Divergence (light blue):** Indicates that the representations in that layer are similar to the baseline distribution. This could suggest that the layer is learning more general or stable features.
The observation that the "Subject" category has the highest divergence suggests that the model's internal representations are most sensitive to variations in the input subject. The "Last Layer" category having the lowest divergence suggests that the final layer's representations are more consolidated and less sensitive to input variations. The trends observed across layers indicate that the model's representations become more stable and less divergent as information propagates through the network.
The differences in divergence patterns between the categories could be due to the specific roles of each component within the model. For example, the attention mechanism might be designed to focus on specific features, leading to higher divergence in its representations. The "Last Layer" might be designed to produce a more stable and consistent output, leading to lower divergence.