TECHNICAL ASSET FINGERPRINT
b538ac8074632efd8db2da9d
Click to view fullscreen
Press ESC or click to close
FOUND IN PAPERS
EXPERT: gemini-2.0-flash VERSION 1
RUNTIME: nugit/gemini/gemini-2.0-flash
INTEL_VERIFIED
## Heatmap: Coverage of Different Generation and Sampling Methods
### Overview
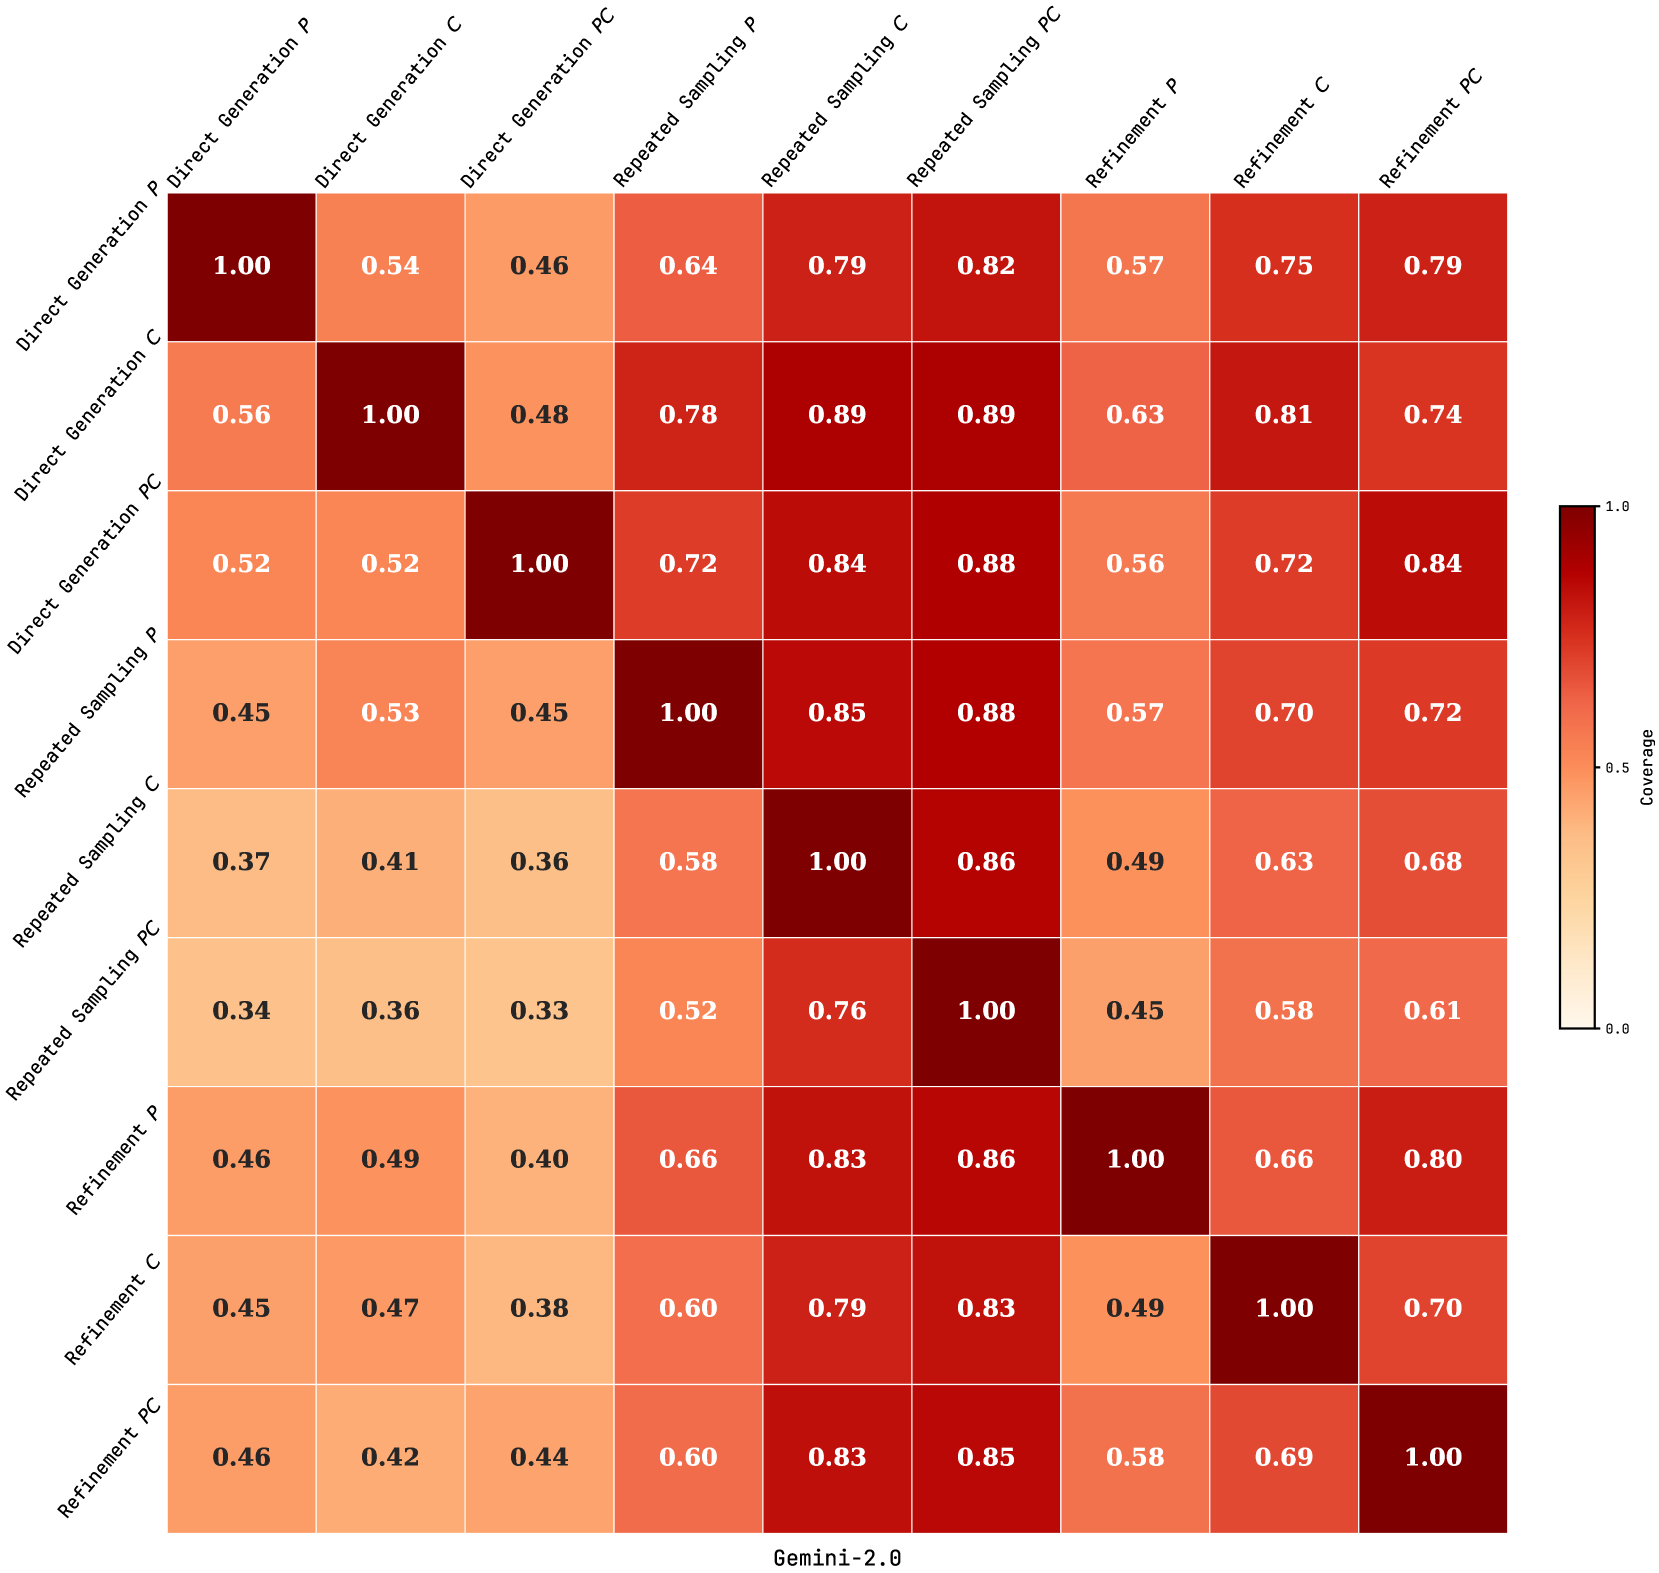
The image is a heatmap showing the coverage between different generation and sampling methods. The methods include Direct Generation, Repeated Sampling, and Refinement, each with variations P, C, and PC. The heatmap uses a color gradient from light beige (0.0) to dark red (1.0) to represent the coverage values.
### Components/Axes
* **Rows and Columns:** The rows and columns represent the different generation and sampling methods:
* Direct Generation P
* Direct Generation C
* Direct Generation PC
* Repeated Sampling P
* Repeated Sampling C
* Repeated Sampling PC
* Refinement P
* Refinement C
* Refinement PC
* **Color Scale (Legend):** Located on the right side of the heatmap.
* Light beige corresponds to a coverage of 0.0.
* Dark red corresponds to a coverage of 1.0.
* Intermediate colors represent coverage values between 0.0 and 1.0.
* **Numerical Values:** Each cell in the heatmap contains a numerical value representing the coverage between the corresponding row and column methods.
### Detailed Analysis
Here's a breakdown of the coverage values between the different methods:
* **Direct Generation:**
* Direct Generation P vs. Direct Generation P: 1.00
* Direct Generation P vs. Direct Generation C: 0.54
* Direct Generation P vs. Direct Generation PC: 0.46
* Direct Generation P vs. Repeated Sampling P: 0.64
* Direct Generation P vs. Repeated Sampling C: 0.79
* Direct Generation P vs. Repeated Sampling PC: 0.82
* Direct Generation P vs. Refinement P: 0.57
* Direct Generation P vs. Refinement C: 0.75
* Direct Generation P vs. Refinement PC: 0.79
* Direct Generation C vs. Direct Generation P: 0.56
* Direct Generation C vs. Direct Generation C: 1.00
* Direct Generation C vs. Direct Generation PC: 0.48
* Direct Generation C vs. Repeated Sampling P: 0.78
* Direct Generation C vs. Repeated Sampling C: 0.89
* Direct Generation C vs. Repeated Sampling PC: 0.89
* Direct Generation C vs. Refinement P: 0.63
* Direct Generation C vs. Refinement C: 0.81
* Direct Generation C vs. Refinement PC: 0.74
* Direct Generation PC vs. Direct Generation P: 0.52
* Direct Generation PC vs. Direct Generation C: 0.52
* Direct Generation PC vs. Direct Generation PC: 1.00
* Direct Generation PC vs. Repeated Sampling P: 0.72
* Direct Generation PC vs. Repeated Sampling C: 0.84
* Direct Generation PC vs. Repeated Sampling PC: 0.88
* Direct Generation PC vs. Refinement P: 0.56
* Direct Generation PC vs. Refinement C: 0.72
* Direct Generation PC vs. Refinement PC: 0.84
* **Repeated Sampling:**
* Repeated Sampling P vs. Direct Generation P: 0.45
* Repeated Sampling P vs. Direct Generation C: 0.53
* Repeated Sampling P vs. Direct Generation PC: 0.45
* Repeated Sampling P vs. Repeated Sampling P: 1.00
* Repeated Sampling P vs. Repeated Sampling C: 0.85
* Repeated Sampling P vs. Repeated Sampling PC: 0.88
* Repeated Sampling P vs. Refinement P: 0.57
* Repeated Sampling P vs. Refinement C: 0.70
* Repeated Sampling P vs. Refinement PC: 0.72
* Repeated Sampling C vs. Direct Generation P: 0.37
* Repeated Sampling C vs. Direct Generation C: 0.41
* Repeated Sampling C vs. Direct Generation PC: 0.36
* Repeated Sampling C vs. Repeated Sampling P: 0.58
* Repeated Sampling C vs. Repeated Sampling C: 1.00
* Repeated Sampling C vs. Repeated Sampling PC: 0.86
* Repeated Sampling C vs. Refinement P: 0.49
* Repeated Sampling C vs. Refinement C: 0.63
* Repeated Sampling C vs. Refinement PC: 0.68
* Repeated Sampling PC vs. Direct Generation P: 0.34
* Repeated Sampling PC vs. Direct Generation C: 0.36
* Repeated Sampling PC vs. Direct Generation PC: 0.33
* Repeated Sampling PC vs. Repeated Sampling P: 0.52
* Repeated Sampling PC vs. Repeated Sampling C: 0.76
* Repeated Sampling PC vs. Repeated Sampling PC: 1.00
* Repeated Sampling PC vs. Refinement P: 0.45
* Repeated Sampling PC vs. Refinement C: 0.58
* Repeated Sampling PC vs. Refinement PC: 0.61
* **Refinement:**
* Refinement P vs. Direct Generation P: 0.46
* Refinement P vs. Direct Generation C: 0.49
* Refinement P vs. Direct Generation PC: 0.40
* Refinement P vs. Repeated Sampling P: 0.66
* Refinement P vs. Repeated Sampling C: 0.83
* Refinement P vs. Repeated Sampling PC: 0.86
* Refinement P vs. Refinement P: 1.00
* Refinement P vs. Refinement C: 0.66
* Refinement P vs. Refinement PC: 0.80
* Refinement C vs. Direct Generation P: 0.45
* Refinement C vs. Direct Generation C: 0.47
* Refinement C vs. Direct Generation PC: 0.38
* Refinement C vs. Repeated Sampling P: 0.60
* Refinement C vs. Repeated Sampling C: 0.79
* Refinement C vs. Repeated Sampling PC: 0.83
* Refinement C vs. Refinement P: 0.49
* Refinement C vs. Refinement C: 1.00
* Refinement C vs. Refinement PC: 0.70
* Refinement PC vs. Direct Generation P: 0.46
* Refinement PC vs. Direct Generation C: 0.42
* Refinement PC vs. Direct Generation PC: 0.44
* Refinement PC vs. Repeated Sampling P: 0.60
* Refinement PC vs. Repeated Sampling C: 0.83
* Refinement PC vs. Repeated Sampling PC: 0.85
* Refinement PC vs. Refinement P: 0.58
* Refinement PC vs. Refinement C: 0.69
* Refinement PC vs. Refinement PC: 1.00
### Key Observations
* The diagonal elements are all 1.00, indicating perfect coverage when a method is compared to itself.
* Repeated Sampling C and PC generally have higher coverage values compared to Direct Generation and Refinement methods.
* Direct Generation P, C, and PC have relatively low coverage when compared to Refinement P, C, and PC.
### Interpretation
The heatmap visualizes the coverage between different generation and sampling methods. The higher the coverage value, the more similar the results produced by the two methods being compared. The data suggests that Repeated Sampling methods, particularly Repeated Sampling C and PC, tend to have higher coverage with other methods compared to Direct Generation and Refinement. This could indicate that Repeated Sampling produces more consistent or comprehensive results across different scenarios. The relatively lower coverage of Direct Generation methods when compared to Refinement methods might suggest that Direct Generation is more sensitive to specific conditions or parameters. The tool used to generate this data is "Gemini-2.0".
DECODING INTELLIGENCE...
EXPERT: nemotron-free VERSION 1
RUNTIME: free/nvidia/nemotron-nano-12b-v2-vl:free
INTEL_VERIFIED
# Technical Document Analysis of Heatmap
## 1. Labels and Axis Titles
- **Rows (Methods)**:
- Direct Generation P
- Direct Generation C
- Direct Generation PC
- Repeated Sampling P
- Repeated Sampling C
- Repeated Sampling PC
- Refinement P
- Refinement C
- Refinement PC
- **Columns (Gemini-2.0 Methods)**:
- Direct Generation P
- Direct Generation C
- Direct Generation PC
- Repeated Sampling P
- Repeated Sampling C
- Repeated Sampling PC
- Refinement P
- Refinement C
- Refinement PC
- **Legend**:
- **Color Scale**: Ranges from **0.0 (light yellow)** to **1.0 (dark red)**.
- **Label**: "Coverage" (explicitly stated in the legend).
---
## 2. Key Trends and Data Points
- **Diagonal Values**: All diagonal cells (e.g., Direct Generation P vs. Direct Generation P) have a value of **1.00**, indicating perfect coverage when comparing a method to itself.
- **Coverage Degradation**:
- Coverage decreases as the distance from the diagonal increases. For example:
- Direct Generation P vs. Repeated Sampling P: **0.64**
- Direct Generation P vs. Refinement P: **0.57**
- The lowest coverage values are in the bottom-left quadrant (e.g., Repeated Sampling PC vs. Refinement PC: **0.33**).
- **Highest Non-Diagonal Coverage**:
- Repeated Sampling C vs. Repeated Sampling PC: **0.89**
- Repeated Sampling P vs. Repeated Sampling C: **0.85**
---
## 3. Data Table Reconstruction
| Method (Row) | Direct Generation P | Direct Generation C | Direct Generation PC | Repeated Sampling P | Repeated Sampling C | Repeated Sampling PC | Refinement P | Refinement C | Refinement PC |
|-----------------------|---------------------|---------------------|----------------------|---------------------|---------------------|----------------------|--------------|--------------|---------------|
| **Direct Generation P** | 1.00 | 0.54 | 0.46 | 0.64 | 0.79 | 0.82 | 0.57 | 0.75 | 0.79 |
| **Direct Generation C** | 0.56 | 1.00 | 0.48 | 0.78 | 0.89 | 0.89 | 0.63 | 0.81 | 0.74 |
| **Direct Generation PC**| 0.52 | 0.52 | 1.00 | 0.72 | 0.84 | 0.88 | 0.56 | 0.72 | 0.84 |
| **Repeated Sampling P** | 0.45 | 0.53 | 0.45 | 1.00 | 0.85 | 0.88 | 0.57 | 0.70 | 0.72 |
| **Repeated Sampling C** | 0.37 | 0.41 | 0.36 | 0.58 | 1.00 | 0.86 | 0.49 | 0.63 | 0.68 |
| **Repeated Sampling PC**| 0.34 | 0.36 | 0.33 | 0.52 | 0.76 | 1.00 | 0.45 | 0.58 | 0.61 |
| **Refinement P** | 0.46 | 0.49 | 0.40 | 0.66 | 0.83 | 0.86 | 1.00 | 0.66 | 0.80 |
| **Refinement C** | 0.45 | 0.47 | 0.38 | 0.60 | 0.79 | 0.83 | 0.49 | 1.00 | 0.70 |
| **Refinement PC** | 0.46 | 0.42 | 0.44 | 0.60 | 0.83 | 0.85 | 0.58 | 0.69 | 1.00 |
---
## 4. Legend and Color Matching
- **Legend Position**: Right side of the heatmap.
- **Color Matching**:
- **Dark Red** (1.00) matches the diagonal.
- **Light Yellow** (0.33–0.45) matches the lowest values in the bottom-left quadrant.
- Intermediate values (e.g., 0.5–0.8) use gradient shades of orange/red.
---
## 5. Spatial Grounding
- **Legend Placement**: Right of the heatmap.
- **Axis Labels**:
- Rows: Left side.
- Columns: Top of the heatmap.
---
## 6. Trend Verification
- **Row Trends**:
- **Direct Generation P**: Starts at 1.00 (diagonal), decreases to 0.54 (Direct Generation C), then 0.46 (Direct Generation PC), and further declines to 0.57 (Refinement P).
- **Refinement PC**: Starts at 1.00 (diagonal), decreases to 0.46 (Direct Generation P), then 0.42 (Direct Generation C), and stabilizes at 0.69 (Refinement C).
- **Column Trends**:
- **Refinement P**: Starts at 1.00 (diagonal), decreases to 0.46 (Direct Generation P), then 0.49 (Direct Generation C), and stabilizes at 0.66 (Refinement C).
---
## 7. Component Isolation
- **Header**: Row labels (methods).
- **Main Chart**: 9x9 heatmap with coverage values.
- **Footer**: Legend (color scale).
---
## 8. Additional Notes
- **Language**: All text is in English.
- **Data Completeness**: All 81 cells are filled with numerical values.
- **No Missing Data**: No empty cells or annotations.
---
## 9. Final Observations
- The heatmap quantifies **coverage similarity** between different methods (e.g., Direct Generation vs. Refinement).
- **High Coverage** (near 1.00) indicates strong alignment between methods.
- **Low Coverage** (near 0.3–0.5) suggests significant divergence in performance or output.
DECODING INTELLIGENCE...