\n
## Scatter Plot: GCI Value vs. Citations
### Overview
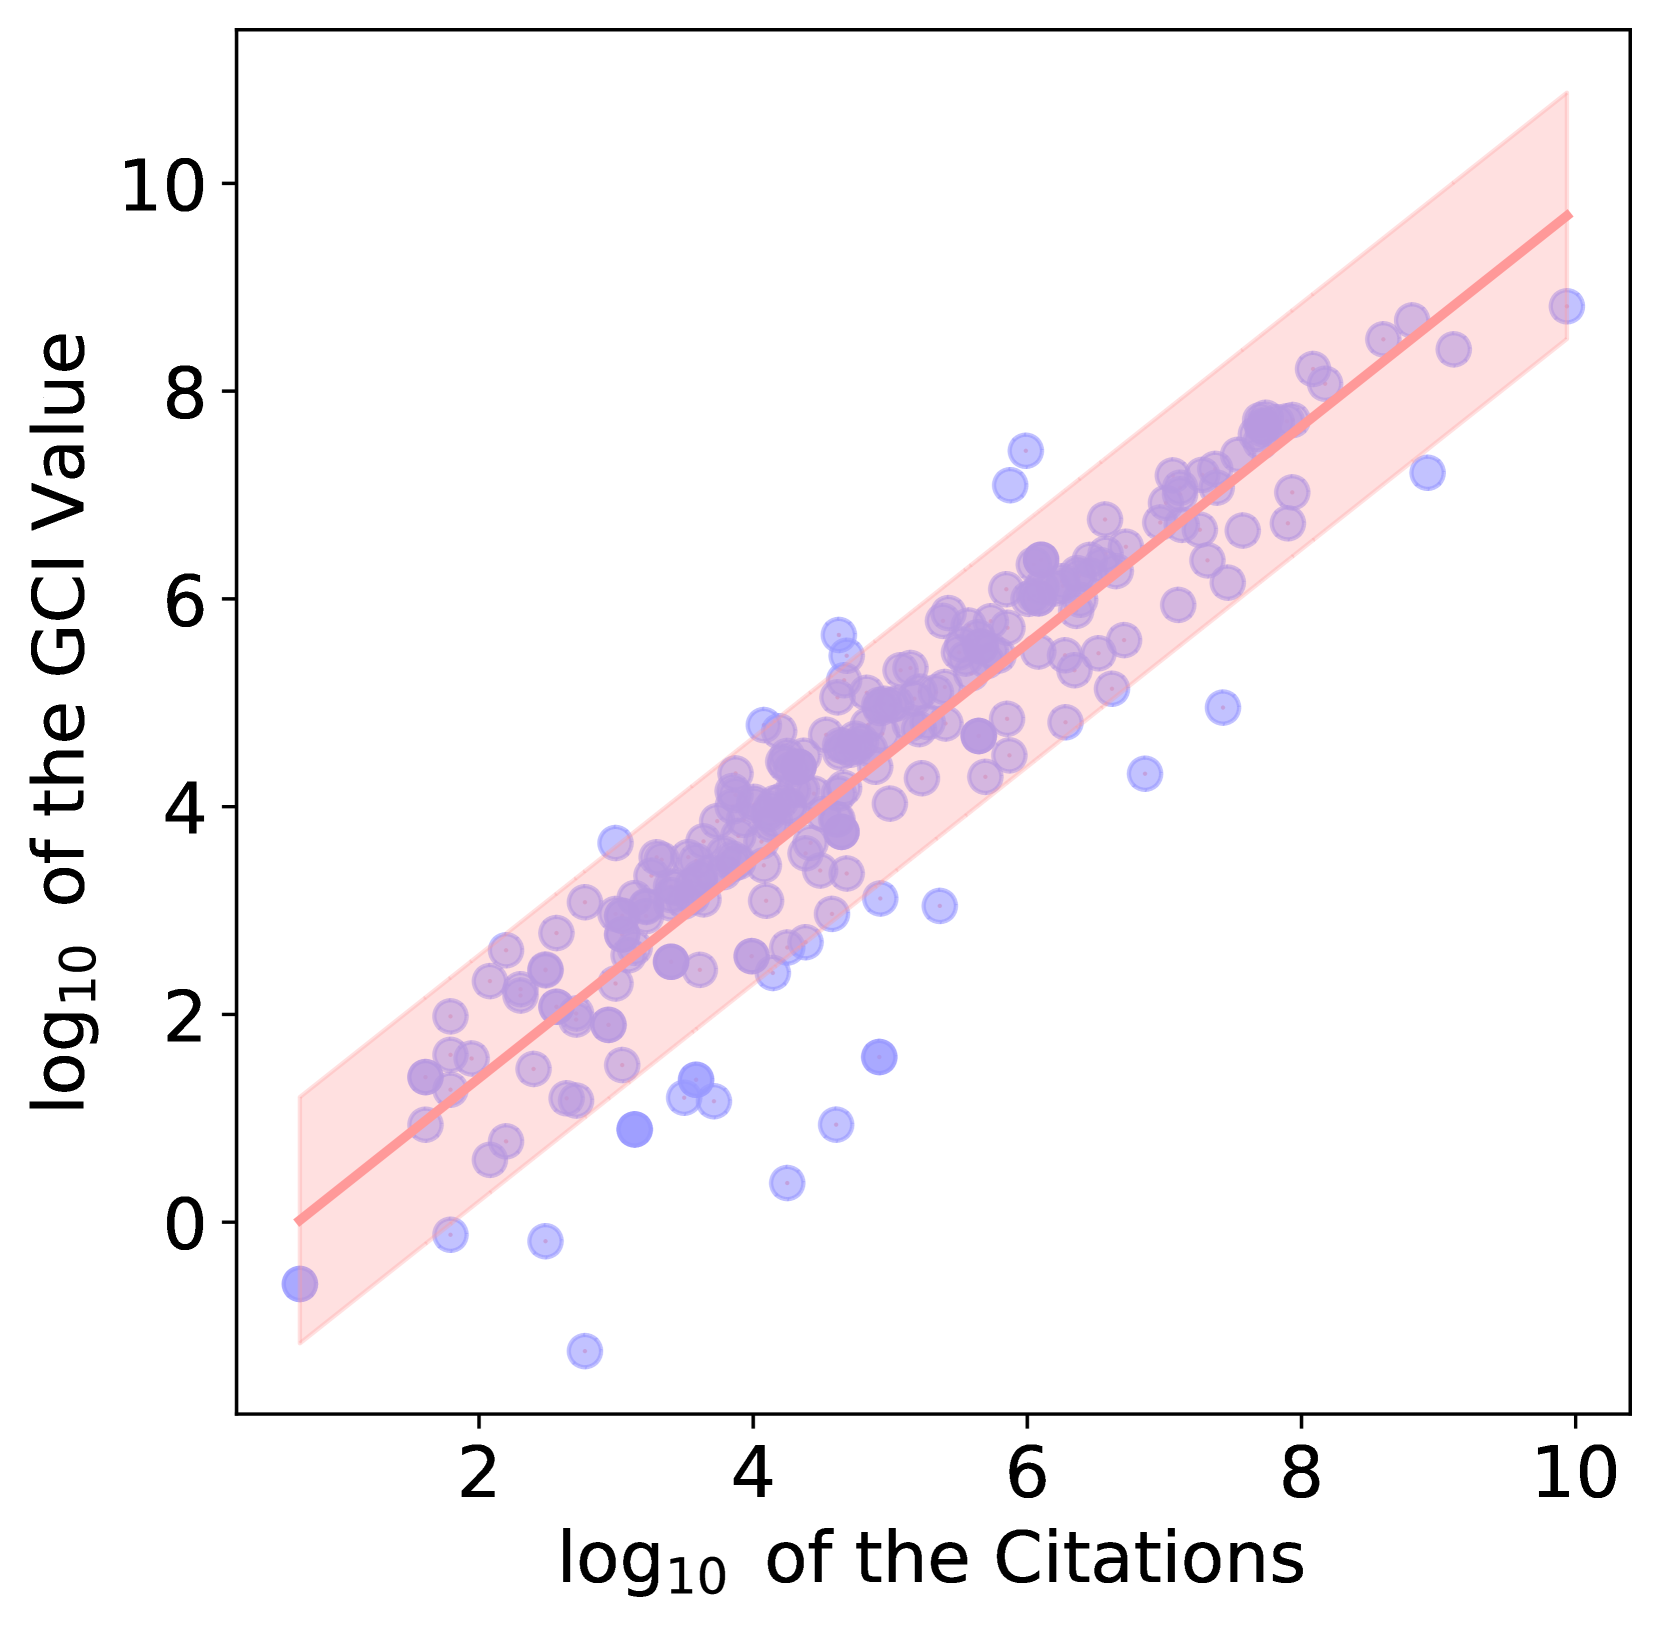
The image presents a scatter plot illustrating the relationship between the base-10 logarithm of the GCI (Global Citation Index) Value and the base-10 logarithm of the number of Citations. A regression line with a shaded 95% confidence interval is overlaid on the data points.
### Components/Axes
* **X-axis:** Labeled "log₁₀ of the Citations". Scale ranges from approximately 1 to 10.
* **Y-axis:** Labeled "log₁₀ of the GCI Value". Scale ranges from approximately 0 to 10.
* **Data Points:** Approximately 200 individual data points are scattered across the plot, represented by translucent blue circles.
* **Regression Line:** A solid, reddish-pink line representing the linear regression fit to the data.
* **Confidence Interval:** A shaded region around the regression line, colored in a lighter reddish-pink, representing the 95% confidence interval.
### Detailed Analysis
The scatter plot shows a positive correlation between the log₁₀ of citations and the log₁₀ of the GCI value. The data points generally trend upwards from the bottom-left to the top-right of the plot.
The regression line has a positive slope, indicating that as the number of citations increases, the GCI value also tends to increase.
Here's an approximate reconstruction of data points, noting the scatter and overlap:
* **Low Citations (log₁₀ ≈ 2):** GCI values range from approximately 0.5 to 3.
* **Medium Citations (log₁₀ ≈ 4-6):** GCI values range from approximately 2 to 7. The density of points is highest in this region.
* **High Citations (log₁₀ ≈ 8-10):** GCI values range from approximately 5 to 8.5.
The regression line appears to start at approximately (1, 0.5) and end at approximately (10, 8.5). The confidence interval widens as the citation count increases.
### Key Observations
* The relationship between citations and GCI value is not perfectly linear, as evidenced by the scatter of points around the regression line.
* There is a noticeable cluster of data points around log₁₀(Citations) = 4-6 and log₁₀(GCI Value) = 3-6.
* The spread of data points increases with increasing citation counts, suggesting greater variability in GCI values for highly cited works.
* There are a few outliers with relatively low GCI values for a given number of citations, and vice versa.
### Interpretation
The data suggests a strong positive correlation between the number of citations a work receives and its GCI value. This is expected, as both metrics are indicators of a work's impact and influence within its field. The logarithmic transformation of both axes likely serves to reduce the influence of extreme values and to linearize the relationship.
The confidence interval around the regression line indicates the uncertainty in the estimated relationship. The widening of the confidence interval at higher citation counts suggests that the relationship may become less predictable as citation numbers increase.
The outliers may represent works that are highly cited for reasons other than their inherent quality (e.g., methodological flaws, controversial findings) or works with high GCI values despite receiving relatively few citations (e.g., highly influential works in niche fields).
The plot demonstrates a clear trend, but also highlights the inherent variability in the relationship between citations and GCI value. It is important to note that correlation does not imply causation, and other factors may also contribute to a work's GCI value.