## Scatter Plot with Regression Line: Relationship between Citations and GCI Value
### Overview
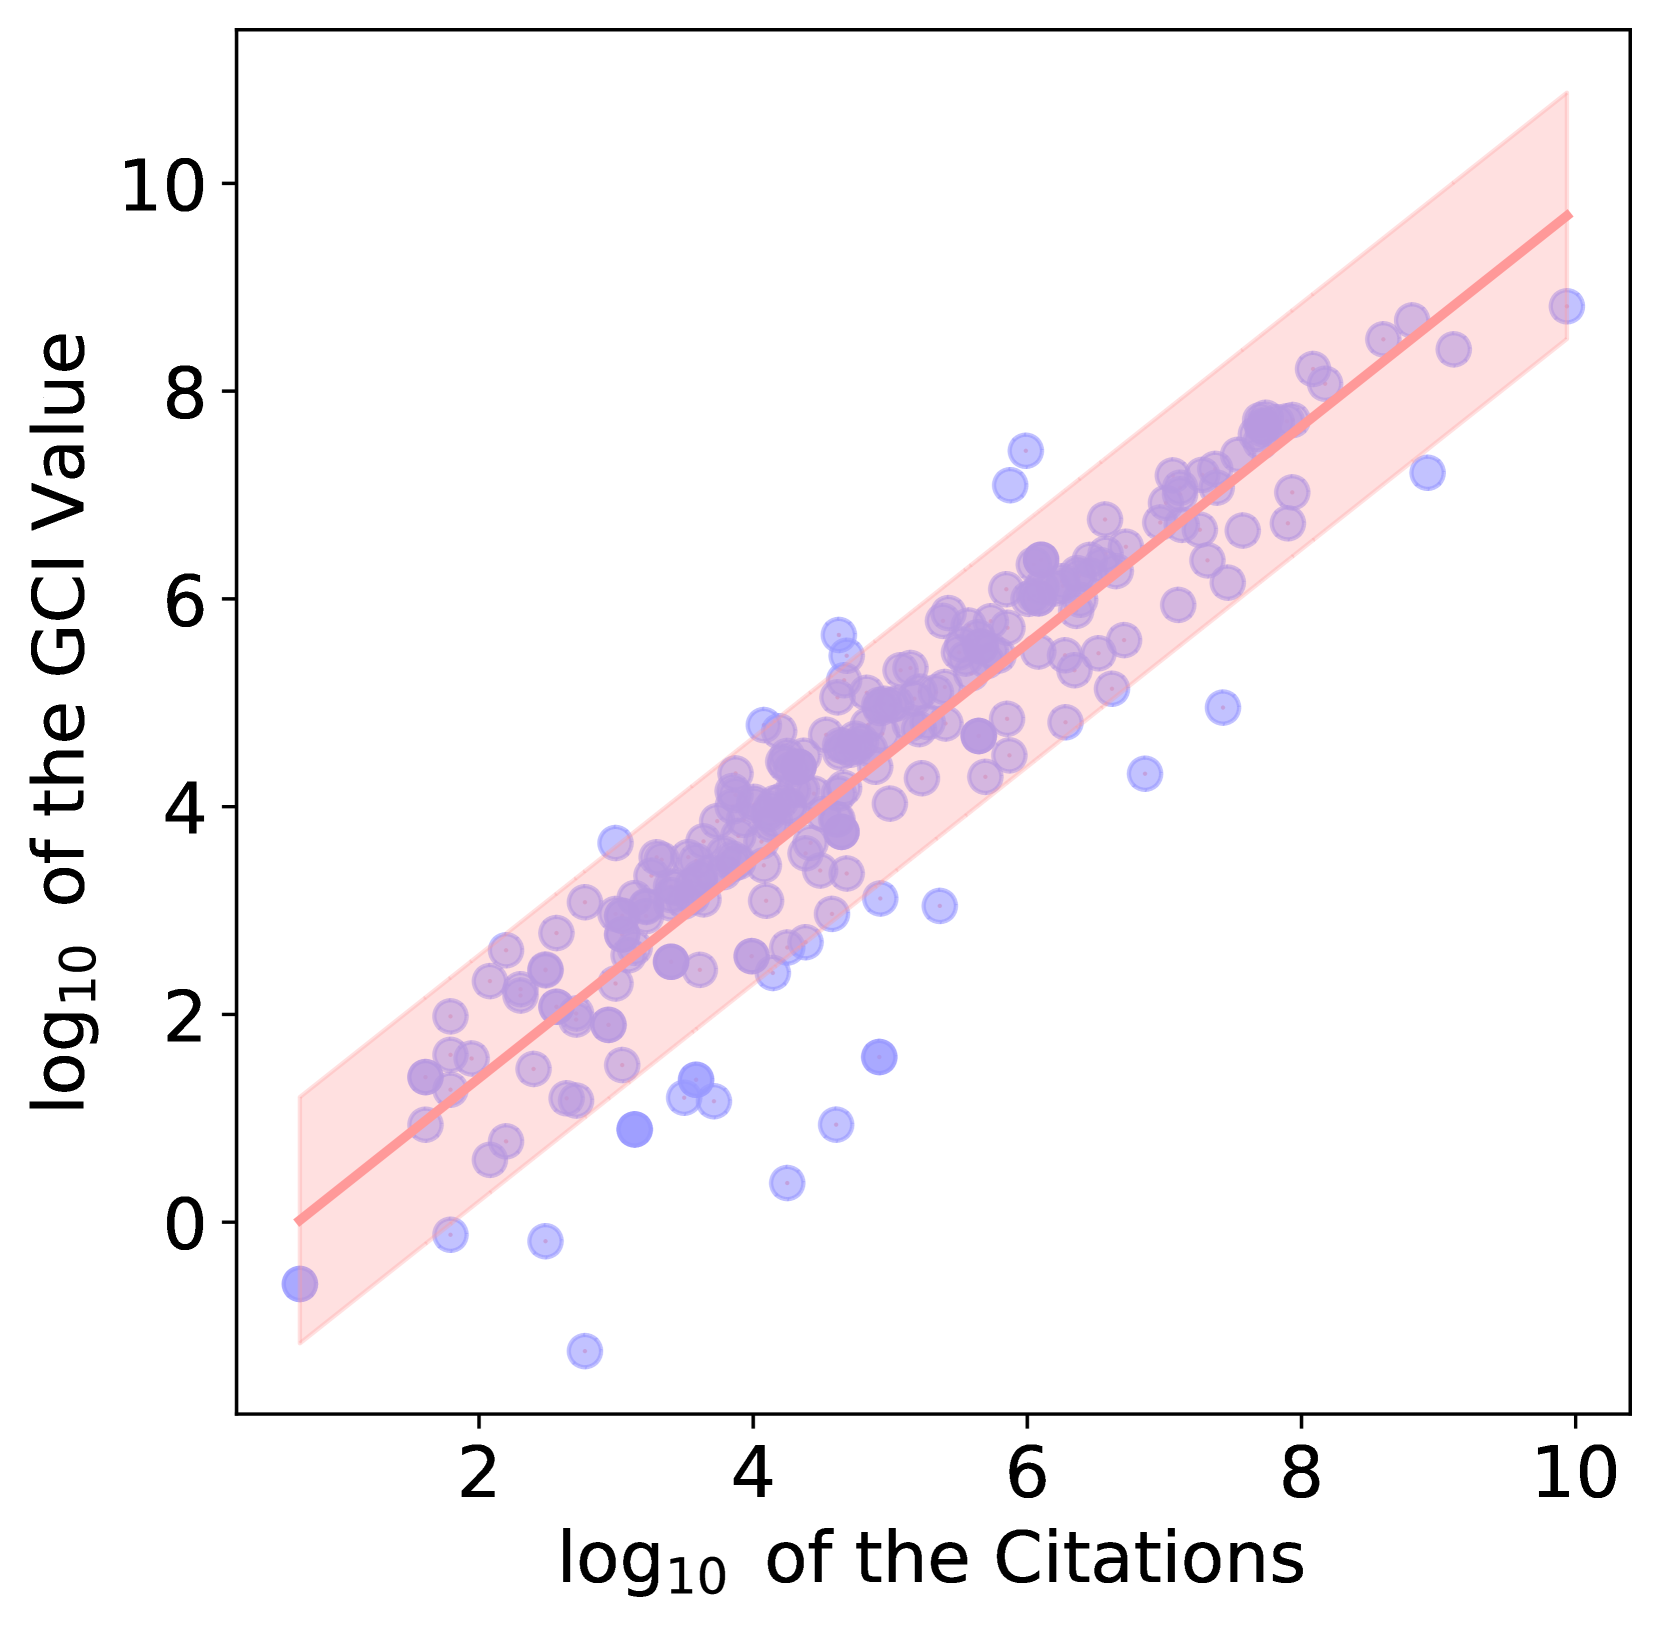
The image is a scatter plot displaying the relationship between two logarithmic variables: the base-10 logarithm of citation counts and the base-10 logarithm of a "GCI Value." A linear regression line with a shaded confidence interval is overlaid on the data points. The plot suggests a strong, positive correlation between the two metrics.
### Components/Axes
* **X-Axis:** Labeled "log₁₀ of the Citations". The scale runs from 0 to 10, with major tick marks at intervals of 2 (0, 2, 4, 6, 8, 10).
* **Y-Axis:** Labeled "log₁₀ of the GCI Value". The scale runs from approximately -1 to 11, with major tick marks at intervals of 2 (0, 2, 4, 6, 8, 10).
* **Data Series:** Represented by semi-transparent purple circles. There is no legend, indicating a single data series.
* **Regression Line:** A solid red line running diagonally from the lower-left to the upper-right of the plot area.
* **Confidence Interval:** A light red, semi-transparent shaded band surrounding the regression line, representing the uncertainty of the fit.
### Detailed Analysis
* **Trend Verification:** The data points form a clear, upward-sloping cloud from the bottom-left to the top-right. The red regression line follows this trend precisely, confirming a strong positive linear relationship between the log-transformed variables.
* **Data Distribution:** The majority of data points are clustered tightly around the regression line, particularly in the central region of the plot (x-axis values between 2 and 8). The density of points appears highest in the range of x=3 to x=7.
* **Regression Line Path:** The line originates near the coordinate (0, 0) and terminates near (10, 10). This suggests a slope close to 1, indicating that a one-unit increase in log₁₀(Citations) is associated with approximately a one-unit increase in log₁₀(GCI Value).
* **Confidence Interval Width:** The shaded confidence interval is narrowest in the center of the data cloud (around x=5) and widens noticeably at both the lower (x < 2) and upper (x > 8) extremes of the x-axis, where data points are sparser.
* **Outliers:** Several data points lie outside the main cluster and the confidence band. Notable outliers include:
* A point near (x=3, y=-1.2), significantly below the trend.
* A point near (x=4.5, y=0.5), also well below the trend.
* A point near (x=6, y=7.5), above the trend.
* A point near (x=7.5, y=5), below the trend.
### Key Observations
1. **Strong Positive Correlation:** The primary observation is the robust, positive linear relationship between the logarithm of citations and the logarithm of the GCI Value.
2. **Log-Log Relationship:** The use of logarithmic scales on both axes implies the underlying relationship between the raw (non-log) variables is likely multiplicative or power-law in nature.
3. **Heteroscedasticity:** The widening of the confidence interval at the extremes suggests the variance of the residuals (the scatter of points around the line) may not be constant across all values, a condition known as heteroscedasticity.
4. **Data Sparsity at Extremes:** There are fewer data points at the very low and very high ends of the citation scale (log₁₀ values < 2 and > 8).
### Interpretation
The data demonstrates that the GCI Value is strongly and positively associated with the number of citations. The near 1:1 slope on the log-log plot suggests that the GCI Value scales proportionally with citations across several orders of magnitude. This implies that the GCI metric is likely designed to reflect or is inherently linked to scholarly impact as measured by citation counts.
The presence of outliers indicates that while the general trend is very strong, there are individual cases where the GCI Value is either unexpectedly high or low relative to the citation count. These could represent interesting anomalies—for instance, a paper with few citations but a high GCI might indicate high quality or influence in a niche field, while a highly cited paper with a low GCI might suggest different types of impact or methodological considerations in the GCI calculation.
The widening confidence interval at the extremes is a standard statistical artifact due to fewer data points, but it also serves as a caution that predictions based on this model are less reliable for entities with extremely low or extremely high citation counts. Overall, the chart provides compelling visual evidence that citations and the GCI Value are deeply interconnected metrics.