## Scatter Plot with Regression Line and Confidence Interval: Relationship Between Citations and GCI Value
### Overview
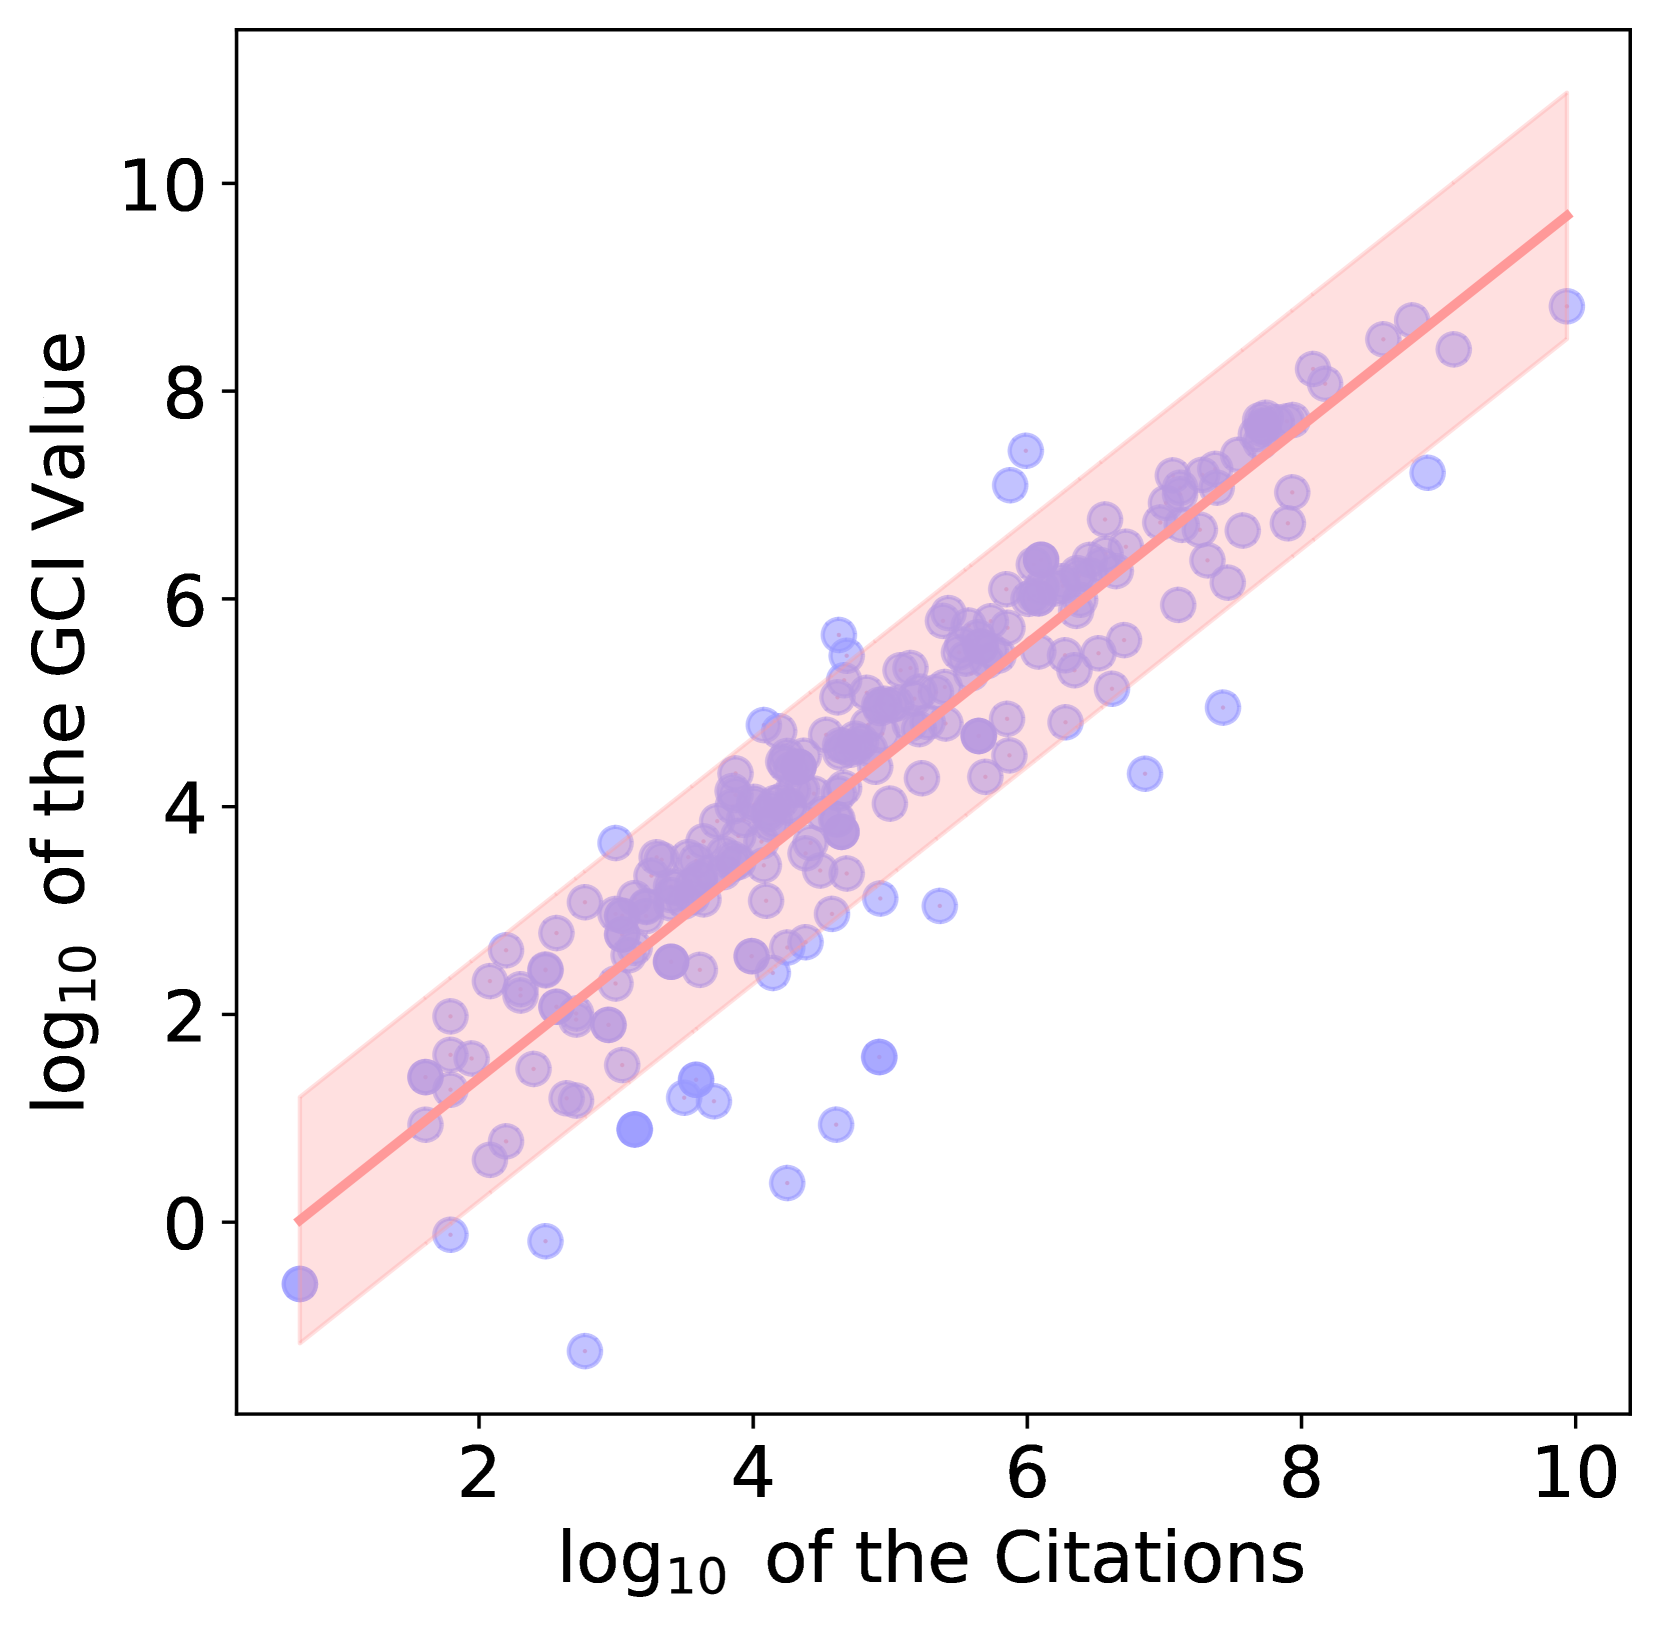
The image is a scatter plot showing the relationship between the logarithm (base 10) of citations and the logarithm (base 10) of the GCI (General Citation Index) value. Data points are represented as blue circles, with a red regression line and a pink shaded confidence interval. The plot spans a range of citation values from approximately 10¹ to 10¹⁰ and GCI values from 10⁰ to 10¹⁰.
---
### Components/Axes
- **X-axis**: "log₁₀ of the Citations" (logarithmic scale, values from ~1 to 10).
- **Y-axis**: "log₁₀ of the GCI Value" (logarithmic scale, values from ~0 to 10).
- **Data Points**: Blue circles (numerous, densely clustered around the regression line).
- **Regression Line**: Red line with a slope of approximately 1, indicating a linear relationship on the log-log scale.
- **Confidence Interval**: Pink shaded region surrounding the regression line, representing the 95% confidence interval.
- **Legend**: Not explicitly labeled, but the red line and pink shading are visually distinct.
---
### Detailed Analysis
- **Data Points**:
- Most points cluster tightly around the red regression line, suggesting a strong positive correlation.
- A few outliers exist, particularly at higher citation values (e.g., log₁₀ citations > 8), where points deviate slightly above or below the line.
- The density of points increases near the center of the plot (log₁₀ citations ~4–6, log₁₀ GCI ~4–6).
- **Regression Line**:
- The slope of the red line is approximately 1, meaning a 10-fold increase in citations corresponds to a 10-fold increase in GCI value.
- The line passes through the origin (0,0), implying no intercept in the log-log relationship.
- **Confidence Interval**:
- The pink shaded area is narrow, indicating a high degree of certainty in the regression line.
- The interval widens slightly at the extremes of the data range (e.g., log₁₀ citations < 2 or > 8).
---
### Key Observations
1. **Positive Correlation**: The data strongly supports a direct relationship between citations and GCI value, with a near 1:1 proportionality on the log-log scale.
2. **Outliers**: A small number of points (e.g., log₁₀ citations ~3, log₁₀ GCI ~1) fall below the regression line, suggesting exceptions to the general trend.
3. **Confidence Interval**: The tightness of the pink shading reinforces the reliability of the regression line, though minor variability is observed at the edges of the data.
---
### Interpretation
The plot demonstrates that the GCI value increases proportionally with the number of citations, as evidenced by the near-linear relationship on the log-log scale. The slope of 1 suggests that a 10x increase in citations leads to a 10x increase in GCI, indicating a multiplicative relationship. The confidence interval’s narrowness implies high statistical significance, though the presence of outliers (e.g., at log₁₀ citations ~3) suggests potential anomalies or external factors influencing GCI values. This could reflect variations in citation quality, publication context, or other unmeasured variables. The log-log scaling emphasizes the exponential nature of the relationship, which is critical for understanding the dynamics of citation impact in academic or research contexts.