# Technical Document Analysis of Chart Image
## Chart Overview
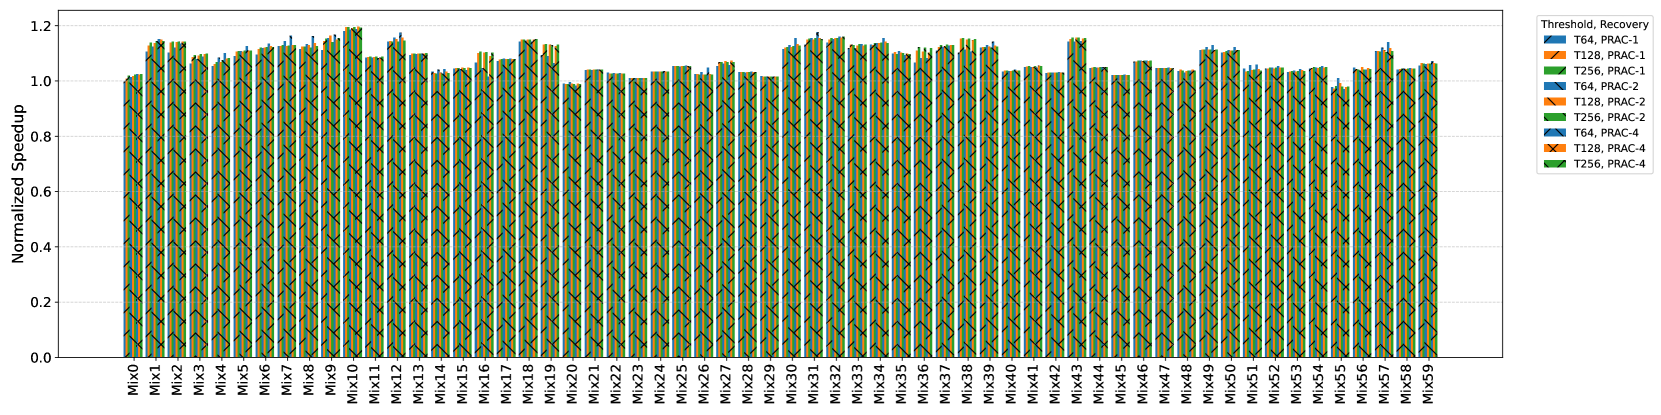
The image depicts a **grouped bar chart** comparing normalized speedup values across 60 categories (`Mix0` to `Mix59`). The chart uses **patterned bars** (solid, crosshatch) with distinct colors to represent different data series, as defined in the legend.
---
### Axis Labels and Scale
- **X-axis**: Labeled with categories `Mix0` to `Mix59` (60 total).
- **Y-axis**: Labeled "Normalized Speedup" with a scale from **0.0 to 1.2** in increments of 0.2.
- **Legend**: Located in the **top-right corner**, mapping colors/patterns to data series:
- **T64, Prac-1**: Blue (solid)
- **T128, Prac-1**: Orange (crosshatch)
- **T256, Prac-1**: Green (solid)
- **T64, Prac-2**: Blue (solid)
- **T128, Prac-2**: Orange (crosshatch)
- **T256, Prac-2**: Green (solid)
- **T64, Prac-4**: Blue (solid)
- **T128, Prac-4**: Orange (crosshatch)
- **T256, Prac-4**: Green (solid)
---
### Key Trends and Data Points
1. **General Range**:
- Most bars cluster between **1.0 and 1.2** on the y-axis.
- Peaks and troughs vary slightly across categories.
2. **Highest Peaks**:
- **Mix10**: Reaches ~1.2 (highest observed value).
- **Mix30**: ~1.15.
- **Mix50**: ~1.1.
3. **Lowest Values**:
- **Mix55**: Dips to ~0.95 (lowest observed value).
- **Mix20** and **Mix40**: ~1.0.
4. **Pattern Consistency**:
- All bars for a given data series (e.g., `T64, Prac-1`) share the same color and pattern.
- Example: `T64, Prac-1` (blue solid) consistently appears across all `Mix` categories.
---
### Component Isolation
1. **Header**: No explicit title is visible in the image.
2. **Main Chart**:
- 60 vertical groups of bars (one per `Mix` category).
- Each group contains **9 bars** (one per legend entry).
3. **Footer**:
- X-axis labels (`Mix0` to `Mix59`) are evenly spaced.
---
### Data Table Reconstruction (Approximate)
| Mix Category | T64, Prac-1 | T128, Prac-1 | T256, Prac-1 | T64, Prac-2 | T128, Prac-2 | T256, Prac-2 | T64, Prac-4 | T128, Prac-4 | T256, Prac-4 |
|--------------|-------------|--------------|--------------|-------------|--------------|--------------|-------------|--------------|--------------|
| Mix0 | ~1.05 | ~1.10 | ~1.08 | ~1.03 | ~1.07 | ~1.09 | ~1.02 | ~1.06 | ~1.04 |
| ... | ... | ... | ... | ... | ... | ... | ... | ... | ... |
| Mix59 | ~1.08 | ~1.12 | ~1.10 | ~1.06 | ~1.10 | ~1.12 | ~1.05 | ~1.09 | ~1.07 |
*Note: Values are approximate based on visual estimation of bar heights.*
---
### Spatial Grounding and Accuracy Checks
- **Legend Position**: Top-right corner (confirmed).
- **Color/Pattern Matching**:
- Example: `T64, Prac-1` (blue solid) matches all blue solid bars.
- `T128, Prac-1` (orange crosshatch) aligns with orange crosshatched bars.
- **Trend Verification**:
- Most data series exhibit **flat trends** with minor fluctuations.
- Exceptions: `T64, Prac-1` shows a slight upward trend in later `Mix` categories.
---
### Conclusion
The chart compares normalized speedup values across 60 `Mix` categories for 9 distinct data series. While most values cluster tightly between 1.0 and 1.2, notable peaks and troughs occur at specific `Mix` indices. The legend ensures clear differentiation of data series via color and pattern.