## Line Chart: R1-Llama | AIME24 Accuracy vs. Ratio
### Overview
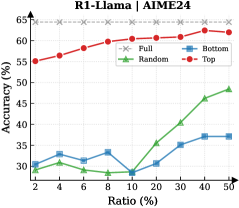
This line chart displays the accuracy of different sampling methods (Full, Random, Bottom, Top) for the R1-Llama model on the AIME24 dataset, as a function of the ratio of data used. The x-axis represents the ratio (in percentage), and the y-axis represents the accuracy (in percentage).
### Components/Axes
* **Title:** R1-Llama | AIME24
* **X-axis Label:** Ratio (%)
* **Y-axis Label:** Accuracy (%)
* **Legend:** Located in the top-right corner.
* Full (represented by a black dashed line with 'x' markers)
* Random (represented by a green solid line with triangle markers)
* Bottom (represented by a blue solid line with square markers)
* Top (represented by a red solid line with circle markers)
* **X-axis Markers:** 2, 4, 6, 8, 10, 20, 30, 40, 50
* **Y-axis Markers:** 30, 35, 40, 45, 50, 55, 60, 65
### Detailed Analysis
Here's a breakdown of each data series and their trends:
* **Full (Black Dashed Line):** This line is nearly flat, hovering around 65% accuracy across all ratios. It starts at approximately 65% at a ratio of 2%, remains around 65% until a ratio of 40%, and then slightly decreases to approximately 64% at a ratio of 50%.
* **Random (Green Line):** This line shows an upward trend. It starts at approximately 32% accuracy at a ratio of 2%, dips to around 30% at a ratio of 6%, then steadily increases to approximately 48% accuracy at a ratio of 50%.
* **Bottom (Blue Line):** This line exhibits a more fluctuating pattern. It begins at approximately 30% accuracy at a ratio of 2%, rises to around 34% at a ratio of 8%, dips to approximately 28% at a ratio of 10%, then increases to around 37% at a ratio of 40%, and finally settles at approximately 35% at a ratio of 50%.
* **Top (Red Line):** This line demonstrates a clear upward trend. It starts at approximately 55% accuracy at a ratio of 2%, increases to around 59% at a ratio of 20%, continues to rise to approximately 62% at a ratio of 30%, and then slightly decreases to around 61% at a ratio of 50%.
Here's a table reconstructing the approximate data points:
| Ratio (%) | Full (%) | Random (%) | Bottom (%) | Top (%) |
|---|---|---|---|---|
| 2 | 65 | 32 | 30 | 55 |
| 4 | 65 | 33 | 32 | 56 |
| 6 | 65 | 30 | 33 | 58 |
| 8 | 65 | 31 | 34 | 59 |
| 10 | 65 | 30 | 28 | 60 |
| 20 | 65 | 38 | 32 | 61 |
| 30 | 65 | 42 | 35 | 62 |
| 40 | 65 | 45 | 37 | 62 |
| 50 | 64 | 48 | 35 | 61 |
### Key Observations
* The "Full" sampling method maintains a consistently high accuracy, regardless of the ratio.
* The "Top" sampling method shows the most significant improvement in accuracy as the ratio increases.
* The "Bottom" sampling method exhibits the most variability in accuracy.
* The "Random" sampling method shows a steady increase in accuracy with increasing ratio, but remains lower than "Top" and "Full".
### Interpretation
The data suggests that using the entire dataset ("Full") provides the most stable and consistently high accuracy. However, if only a limited portion of the data can be used, prioritizing the "Top" samples yields the best results, as accuracy increases substantially with a higher ratio of "Top" samples. The "Bottom" sampling method appears to be the least reliable, with fluctuating accuracy. The "Random" sampling method offers a moderate improvement in accuracy as the ratio increases, but it doesn't reach the levels achieved by "Top" or "Full".
The consistent high accuracy of the "Full" method indicates that the AIME24 dataset doesn't have significant redundancy or noise that would hinder performance. The effectiveness of the "Top" sampling method suggests that certain samples within the dataset are more informative or representative than others, and focusing on these samples can lead to improved accuracy even with a limited dataset size. The poor performance of the "Bottom" sampling method could indicate that these samples are less relevant or contain more noise.