## 3D Scatter Plot: PCA of Token Positions
### Overview
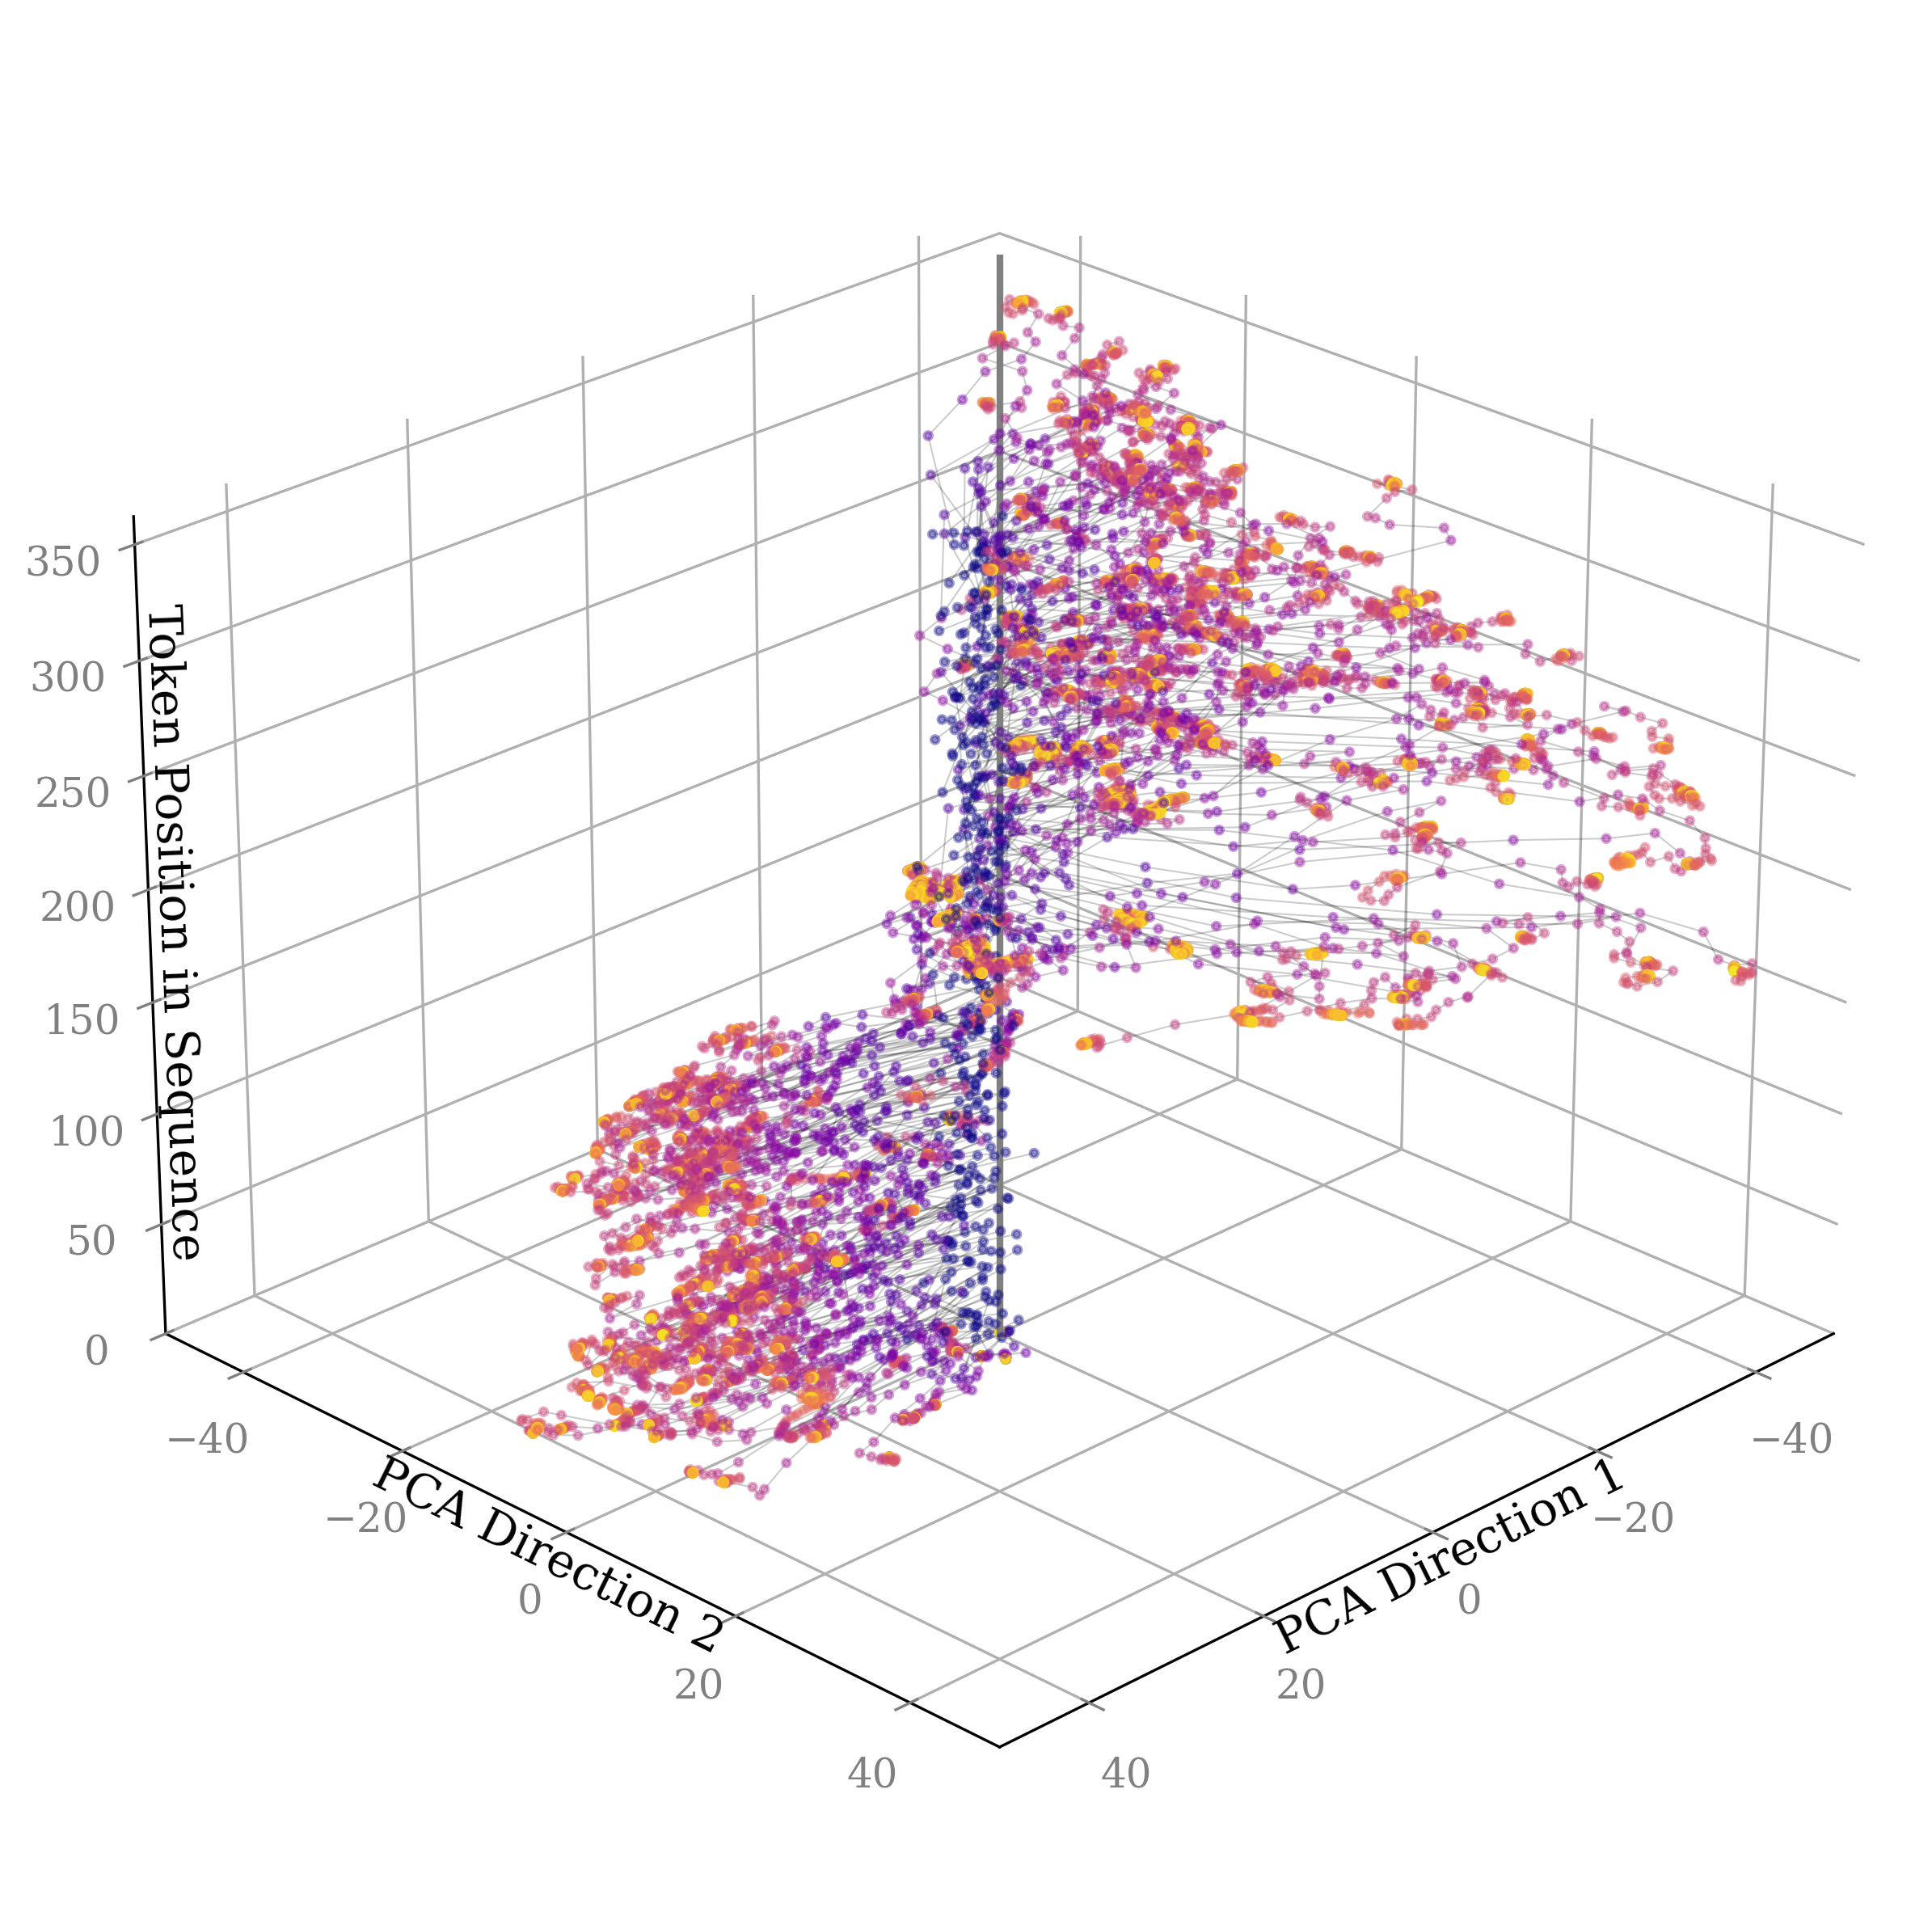
The image is a 3D scatter plot visualizing the relationship between token position in a sequence and two PCA directions. Each point represents a token, with its color varying from purple to orange. The plot shows how tokens are distributed in the 3D space defined by these three variables.
### Components/Axes
* **X-axis:** PCA Direction 1, ranging from approximately -40 to 40.
* **Y-axis:** PCA Direction 2, ranging from approximately -40 to 40.
* **Z-axis:** Token Position in Sequence, ranging from 0 to 350.
* **Data Points:** Each data point is represented by a circle, with color varying from purple to orange. The color gradient is not explicitly defined by a legend, but it appears to represent some underlying variable or cluster.
* **Grid Lines:** Gray grid lines are present on all three planes, aiding in the visualization of data point positions.
### Detailed Analysis
The data points are clustered in a non-uniform distribution.
* **Token Position vs. PCA Directions:**
* At lower token positions (0-100), the data points are spread across a wider range of PCA Direction 1 and PCA Direction 2 values.
* As the token position increases (100-350), the data points tend to cluster more closely around the PCA Direction 2 axis, with PCA Direction 1 values remaining relatively constant.
* **Color Distribution:**
* The data points near the lower token positions (0-100) show a mix of purple and orange colors.
* As the token position increases, the data points tend to be more purple.
* **Specific Data Points:**
* There is a dense cluster of purple points along the Z-axis (Token Position) near PCA Direction 1 = 0 and PCA Direction 2 = 0.
* There are scattered orange points throughout the plot, but they are more prevalent at lower token positions.
### Key Observations
* The token position in the sequence appears to be correlated with the PCA directions.
* The data points cluster more tightly along the PCA Direction 2 axis as the token position increases.
* The color gradient suggests a possible underlying variable or cluster that is related to both token position and PCA directions.
### Interpretation
The 3D scatter plot suggests that the token position in the sequence influences its representation in the PCA space. The clustering of data points at higher token positions indicates that these tokens may share similar characteristics or contexts, as captured by the PCA directions. The color gradient could represent different types of tokens or different stages in the sequence. Further analysis would be needed to determine the exact meaning of the PCA directions and the underlying variable represented by the color gradient. The plot highlights the potential for using PCA to analyze and understand the structure of token sequences.