# Technical Document Extraction: Scatter Plot Analysis
## 1. **Axis Labels and Markers**
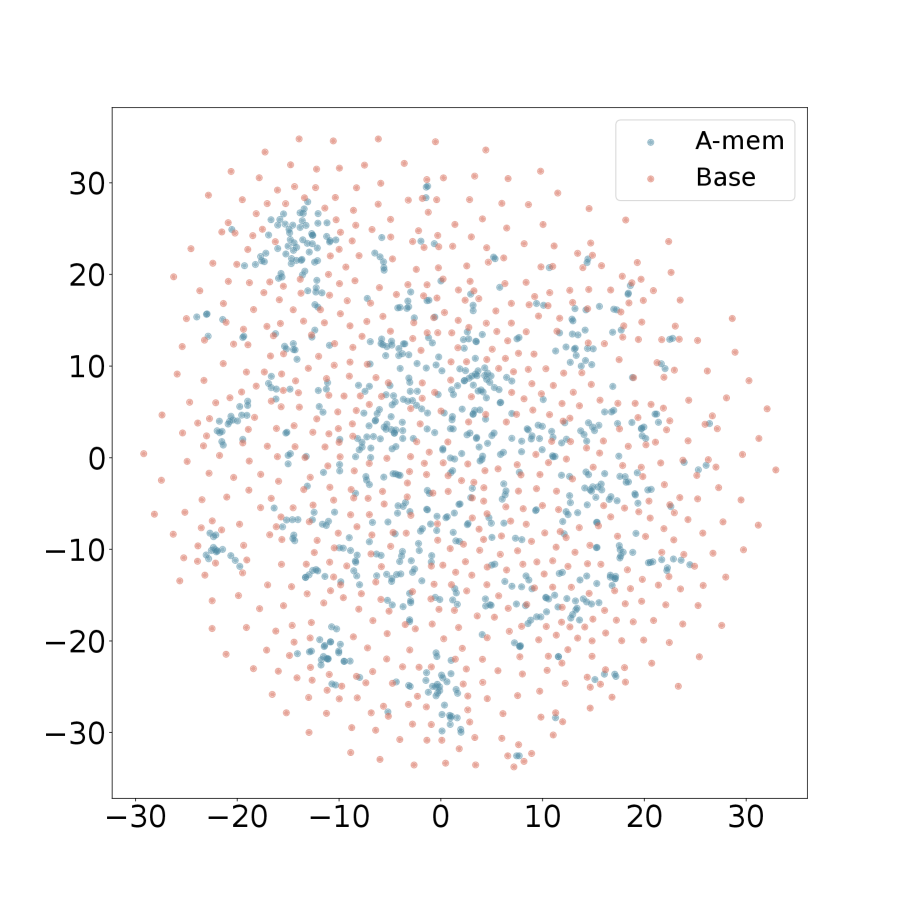
- **X-axis**: Labeled with integer markers from **-30 to 30** in increments of 10.
- **Y-axis**: Labeled with integer markers from **-30 to 30** in increments of 10.
- **No explicit axis titles** (e.g., "X" or "Y") are present in the image.
## 2. **Legend and Data Series**
- **Legend Location**: Top-right corner of the plot.
- **Legend Entries**:
- **A-mem**: Represented by **blue** data points.
- **Base**: Represented by **orange** data points.
- **Spatial Grounding**:
- Legend coordinates: Approximately `[x=25, y=30]` (top-right quadrant, aligned with axis limits).
## 3. **Data Distribution**
- **A-mem (Blue)**:
- **Trend**: Slightly denser clustering in the **upper-left quadrant** (x ≈ -20 to 0, y ≈ 10 to 30).
- **Spread**: Scattered across the entire plot but with higher concentration near the center.
- **Base (Orange)**:
- **Trend**: More uniformly distributed across all quadrants.
- **Spread**: Evenly dispersed with no significant clustering.
## 4. **Visual Confirmation of Legend Accuracy**
- **Color Matching**:
- All **blue** points correspond to the "A-mem" label.
- All **orange** points correspond to the "Base" label.
- **No discrepancies** observed between legend labels and data point colors.
## 5. **Trend Verification**
- **A-mem**: No clear linear or nonlinear trend; data points form a dispersed cloud with minor central clustering.
- **Base**: No discernible trend; points are evenly distributed across the plot.
## 6. **Component Isolation**
- **Main Chart**: Scatter plot occupying the central 90% of the image.
- **Legend**: Isolated in the top-right corner, occupying ~5% of the image area.
- **No Header/Footer**: No additional text or annotations outside the plot area.
## 7. **Additional Observations**
- **Total Data Points**: Approximately **500+** (estimated from visual density).
- **No Text Embedded**: No annotations, equations, or textual descriptions within the plot itself.
- **Language**: All text is in **English**.
## 8. **Conclusion**
The plot visualizes two data series ("A-mem" and "Base") with distinct spatial distributions. "A-mem" exhibits slight clustering in the upper-left quadrant, while "Base" is uniformly distributed. No numerical data table or explicit trends are present beyond the spatial patterns described.