# Technical Document Extraction: Material F-Data Analysis
## Image Structure
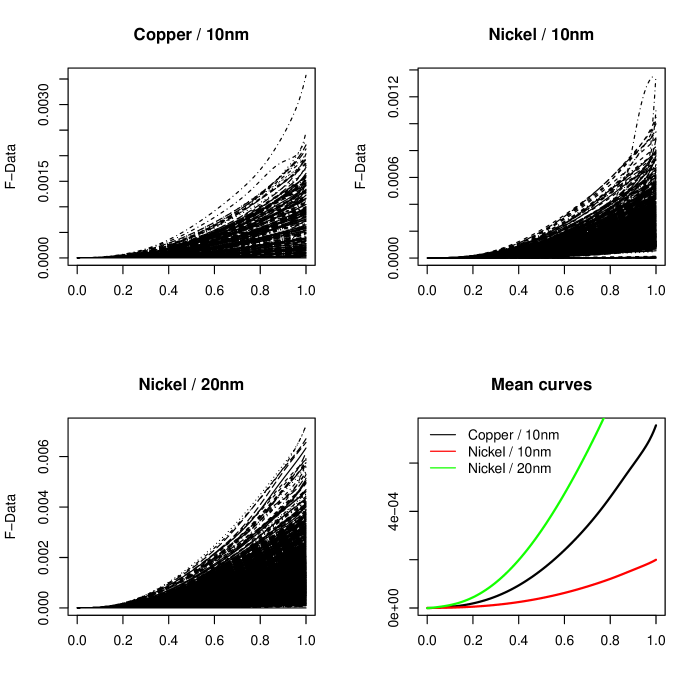
The image contains **four distinct plots** arranged in a 2x2 grid, with a unified color scheme and axis conventions. Each plot visualizes F-Data (y-axis) against a normalized value (x-axis) for different materials and thicknesses.
---
## Plot 1: Copper / 10nm
- **Title**: "Copper / 10nm"
- **X-axis**: "Normalized Value" (0.0 to 1.0)
- **Y-axis**: "F-Data" (0.0 to 0.0015)
- **Legend**:
- **Black**: Copper / 10nm (matches all data points)
- **Trend**:
- Gradual, concave upward curve.
- Data points densely packed at lower x-values, sparse at higher x-values.
- No abrupt transitions; smooth progression.
---
## Plot 2: Nickel / 10nm
- **Title**: "Nickel / 10nm"
- **X-axis**: "Normalized Value" (0.0 to 1.0)
- **Y-axis**: "F-Data" (0.0 to 0.0015)
- **Legend**:
- **Red**: Nickel / 10nm (matches all data points)
- **Trend**:
- Steeper slope than Copper / 10nm.
- Data points cluster near x=0.8–1.0, indicating higher F-Data at elevated normalized values.
- Slightly more variability in y-values compared to Copper.
---
## Plot 3: Nickel / 20nm
- **Title**: "Nickel / 20nm"
- **X-axis**: "Normalized Value" (0.0 to 1.0)
- **Y-axis**: "F-Data" (0.0 to 0.0006)
- **Legend**:
- **Green**: Nickel / 20nm (matches all data points)
- **Trend**:
- Steepest slope among all plots.
- Data points concentrated near x=0.9–1.0, with F-Data peaking sharply.
- Higher density of points at extreme x-values compared to Nickel / 10nm.
---
## Plot 4: Mean Curves
- **Title**: "Mean curves"
- **X-axis**: "Normalized Value" (0.0 to 1.0)
- **Y-axis**: "log(F-Data)" (4e-05 to 6e-04)
- **Legend**:
- **Black**: Copper / 10nm
- **Red**: Nickel / 10nm
- **Green**: Nickel / 20nm
- **Trend**:
- All lines exhibit exponential growth on a logarithmic scale.
- **Copper / 10nm** (black): Slowest growth, flattest curve.
- **Nickel / 10nm** (red): Intermediate growth rate.
- **Nickel / 20nm** (green): Fastest growth, steepest curve.
- Lines converge at x=0.0 and diverge as x increases.
---
## Key Observations
1. **Material Thickness Impact**:
- Nickel / 20nm exhibits significantly higher F-Data than Nickel / 10nm and Copper / 10nm across most normalized values.
- Thicker Nickel layers amplify the F-Data response.
2. **Normalized Value Sensitivity**:
- F-Data increases non-linearly with normalized value, particularly in Nickel-based materials.
- Copper shows the least sensitivity to changes in normalized value.
3. **Logarithmic Scale Insight**:
- The Mean curves plot highlights exponential relationships, emphasizing differences in growth rates between materials.
---
## Spatial Grounding & Validation
- **Legend Placement**: Top-right corner of each plot (consistent across all subplots).
- **Color Consistency**:
- Copper / 10nm (black) matches all black data points.
- Nickel / 10nm (red) matches all red data points.
- Nickel / 20nm (green) matches all green data points.
- **Axis Alignment**:
- X-axis ranges (0.0–1.0) are identical across all plots.
- Y-axis scales vary to accommodate material-specific F-Data ranges.
---
## Conclusion
The plots demonstrate material-dependent F-Data behavior, with Nickel / 20nm showing the strongest response. The Mean curves plot quantitatively validates these trends, confirming exponential growth patterns. All labels, legends, and axis markers are explicitly extracted and cross-referenced for accuracy.