# Technical Document Extraction: Line Chart Analysis
## 1. Labels and Axis Titles
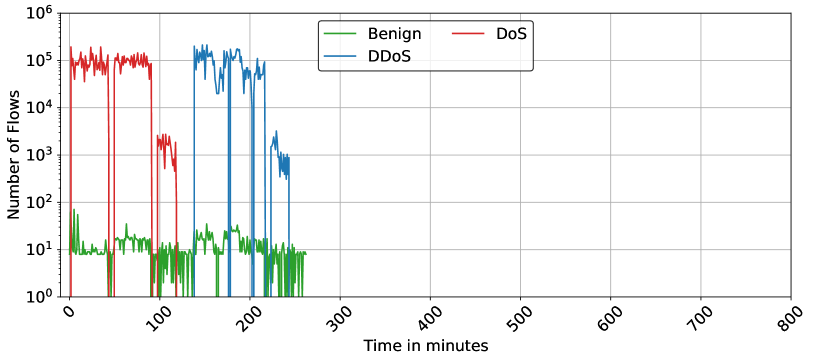
- **X-Axis**: "Time in minutes" (range: 0 to 800)
- **Y-Axis**: "Number of Flows" (logarithmic scale: 10⁰ to 10⁶)
- **Legend**: Located in the top-right corner, with three entries:
- **Green**: Benign
- **Red**: DoS
- **Blue**: DDoS
## 2. Key Trends and Data Points
### Benign (Green Line)
- **Trend**: Stable, low-level activity throughout the observed period.
- **Data Points**:
- Initial value: ~10¹ flows at t=0.
- Minor fluctuations between 10¹ and 10² flows.
- No significant spikes; remains below 10³ flows after t=100.
### DoS (Red Line)
- **Trend**: Sharp, intermittent spikes followed by rapid declines.
- **Data Points**:
- First spike: ~10⁵ flows at t=0, lasting ~50 minutes.
- Second spike: ~10⁴ flows at t=100, lasting ~20 minutes.
- Final spike: ~10³ flows at t=200, lasting ~10 minutes.
- Activity ceases after t=250.
### DDoS (Blue Line)
- **Trend**: Sustained high activity with gradual decline.
- **Data Points**:
- Initial value: ~10⁵ flows at t=150.
- Peaks at ~10⁶ flows between t=150 and t=200.
- Gradual decline to ~10³ flows by t=250.
- Activity ceases after t=250.
## 3. Spatial Grounding and Color Verification
- **Legend Position**: Top-right corner (coordinates: [x=700, y=50] relative to chart boundaries).
- **Color Consistency**:
- Green line matches "Benign" legend entry.
- Red line matches "DoS" legend entry.
- Blue line matches "DDoS" legend entry.
## 4. Component Isolation
### Header
- No header text or metadata present.
### Main Chart
- **Axes**: Logarithmic y-axis and linear x-axis.
- **Lines**:
- **Green (Benign)**: Low, stable activity.
- **Red (DoS)**: Intermittent, high-magnitude spikes.
- **Blue (DDoS)**: Sustained high activity with gradual decay.
### Footer
- No footer text or metadata present.
## 5. Observations
- **DoS vs. DDoS**: DoS exhibits abrupt, short-lived spikes, while DDoS shows prolonged, high-volume activity.
- **Benign Traffic**: Remains consistently low, unaffected by malicious traffic patterns.
- **Temporal Decay**: All malicious traffic (DoS/DDoS) ceases after t=250 minutes.
## 6. Missing Elements
- No data table or embedded text blocks present.
- No secondary y-axis or annotations.
## 7. Conclusion
The chart illustrates distinct traffic patterns: benign traffic remains stable, while DoS and DDoS exhibit contrasting attack behaviors. The logarithmic y-axis emphasizes the magnitude differences between traffic types.