## Screenshot Collage: Software Interface and Content Examples
### Overview
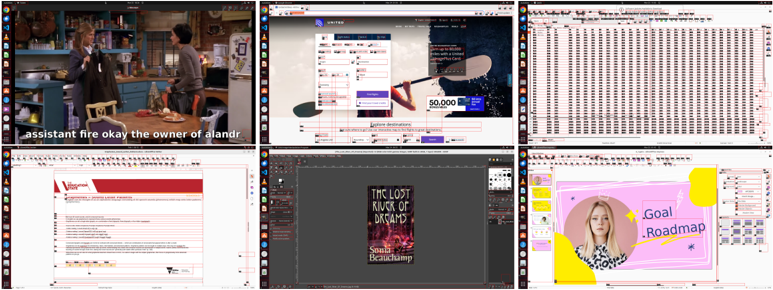
The image displays six distinct software interface screenshots arranged in a 2x3 grid. Each screenshot represents a different application or document type, showcasing user interfaces for media playback, form design, data organization, document creation, graphic design, and presentation building. Textual elements are visible across all panels, with no numerical data or charts present.
### Components/Axes
1. **Top-Left (Media Player)**:
- Subtitles: "assistant fire okay the owner of alandr"
- Scene: Office kitchen environment with two characters
2. **Top-Middle (Form Builder)**:
- Dropdown menu labeled "United"
- Fields: Name, Email, Password
- Value: "50,000" (unclear context)
3. **Top-Right (Spreadsheet)**:
- Headers: "Date," "Time," "Event," "Location"
- Tabular data with 20+ rows (text too small to read)
4. **Bottom-Left (Document Editor)**:
- Header: "Vanguard"
- Section: "Investment Portfolio"
- Text: "Stocks: 65%, Bonds: 35%"
5. **Bottom-Middle (Book Cover Design)**:
- Title: "The Lost River of Dreams"
- Author: "Sonia Beauchamp"
- Design: Dark background with river/forest imagery
6. **Bottom-Right (Presentation Slide)**:
- Title: "Goal Roadmap"
- Visual elements: Pink background, yellow circle, woman's portrait
- Text: "Goal Roadmap" (purple), "Define Objectives," "Set Milestones," "Track Progress"
### Detailed Analysis
- **Media Player**: Subtitles suggest a dialogue from "The Office" TV show, with potential typo in "alandr" (likely "landlord").
- **Form Builder**: Dropdown menu includes country/city selection options. "50,000" appears in a field but lacks context (e.g., currency, points).
- **Spreadsheet**: Structured data format with date/time/event/location columns, but specific entries unreadable.
- **Document Editor**: Financial document showing 65% stocks/35% bonds allocation.
- **Book Cover**: Literary design with title/author clearly visible.
- **Presentation Slide**: Goal-setting framework with three actionable steps listed.
### Key Observations
1. No numerical data series or trends present
2. All text appears in English except potential typo in "alandr"
3. Interfaces represent diverse software categories:
- Media playback
- Form creation
- Data organization
- Document editing
- Graphic design
- Presentation building
4. "50,000" value appears isolated without contextual clues
5. Portfolio percentages suggest balanced investment strategy
### Interpretation
This collage demonstrates a technical workflow spanning multiple domains:
- Media consumption (TV show playback)
- Form development (United interface)
- Data management (spreadsheet)
- Financial documentation (portfolio allocation)
- Creative design (book cover)
- Strategic planning (goal roadmap)
The presence of both completed interfaces (portfolio document, book cover) and development tools (form builder, presentation slide) suggests a multi-stage project environment. The "50,000" value in the form builder remains ambiguous - it could represent a placeholder, a user input error, or a specific data point requiring further context. The typo in "alandr" might indicate either a transcription error or a specialized term requiring domain-specific clarification.