## Diagram: Document Scoring Architecture
### Overview
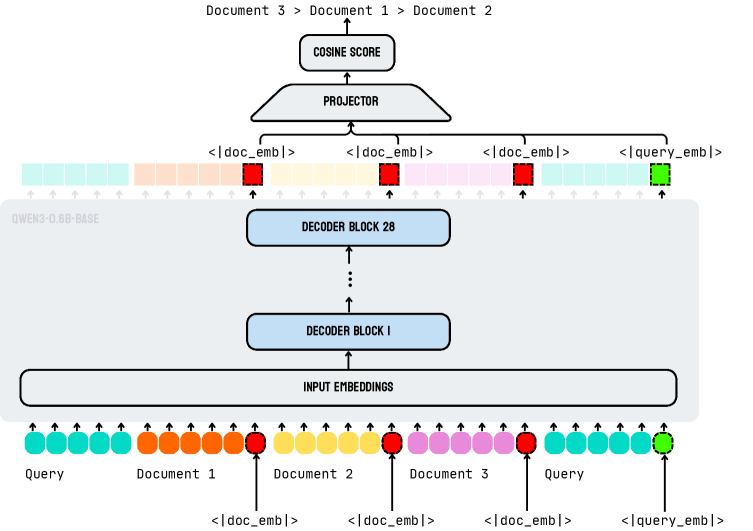
The image illustrates a document scoring architecture, likely used in a retrieval or ranking system. It shows how a query and multiple documents are processed to generate a cosine score, indicating their relevance. The diagram highlights the flow of information from input embeddings through decoder blocks and a projector to the final cosine score.
### Components/Axes
* **Title:** Document 3 > Document 1 > Document 2 (Indicates the ranking order based on the cosine score)
* **Top:** COSINE SCORE
* **Middle:** PROJECTOR
* **Decoder Blocks:** DECODER BLOCK 28, DECODER BLOCK I
* **Input:** INPUT EMBEDDINGS
* **Bottom:** Query, Document 1, Document 2, Document 3, Query
* **Embeddings:** <|doc_emb|>, <|query_emb|>
* **Model:** QWEN3-0.68-BASE (Indicates the model used for generating embeddings)
### Detailed Analysis
The diagram can be broken down into the following stages:
1. **Input Embeddings:**
* The bottom layer represents the input embeddings.
* The input consists of embeddings for a "Query", "Document 1", "Document 2", "Document 3", and another "Query".
* Each document and query is represented by a series of colored blocks, each with an upward-pointing arrow.
* Query: Teal blocks
* Document 1: Orange blocks
* Document 2: Yellow blocks
* Document 3: Pink blocks
* Specific embeddings are marked with "<|doc_emb|>" for documents and "<|query_emb|>" for queries, indicated by a red or green square around the top of the arrow.
* Document embeddings are marked in red.
* Query embeddings are marked in green.
2. **Decoder Blocks:**
* The embeddings are fed into a series of decoder blocks, represented by "DECODER BLOCK I" and "DECODER BLOCK 28".
* The arrow indicates the flow of information from the input embeddings to the decoder blocks.
3. **Projector:**
* The output from the decoder blocks is passed to a "PROJECTOR".
* The projector likely transforms the embeddings into a common space for calculating the cosine score.
4. **Cosine Score:**
* The final output is the "COSINE SCORE", which represents the similarity between the query and each document.
* The title "Document 3 > Document 1 > Document 2" suggests that Document 3 has the highest cosine score, followed by Document 1, and then Document 2.
### Key Observations
* The diagram illustrates a typical architecture for document scoring using embeddings and decoder blocks.
* The ranking of documents is based on the cosine score, with Document 3 being the most relevant and Document 2 being the least relevant.
* The use of "<|doc_emb|>" and "<|query_emb|>" indicates specific embeddings used in the process.
* The model used is "QWEN3-0.68-BASE".
### Interpretation
The diagram depicts a system designed to rank documents based on their relevance to a given query. The process involves embedding the query and documents, processing them through decoder blocks, projecting them into a common space, and then calculating the cosine similarity between the query and each document. The ranking "Document 3 > Document 1 > Document 2" implies that Document 3 is most semantically similar to the query, followed by Document 1, and then Document 2. This architecture is commonly used in information retrieval and natural language processing tasks. The model "QWEN3-0.68-BASE" is likely a pre-trained language model used to generate the initial embeddings.