## Bar Chart: R1-Llama | AIME24 - Content vs. Function Word Ratio
### Overview
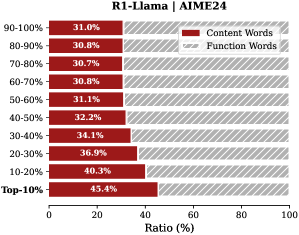
This is a horizontal bar chart comparing the ratio of content words to function words in text generated by R1-Llama, as measured by AIME24. The chart displays the ratio across different percentile ranges of word frequency. The x-axis represents the ratio in percentage, and the y-axis represents the percentile ranges of words.
### Components/Axes
* **Title:** R1-Llama | AIME24
* **X-axis Label:** Ratio (%)
* **Y-axis Label:** Word Frequency Percentile Range (Top 10%, 10-20%, 20-30%, 30-40%, 40-50%, 50-60%, 60-70%, 70-80%, 80-90%, 90-100%)
* **Legend:**
* Content Words (Dark Red)
* Function Words (Light Gray)
### Detailed Analysis
The chart consists of horizontal bars, each representing a percentile range. Each bar is divided into two sections: a dark red section representing the ratio of content words and a light gray section representing the ratio of function words.
Here's a breakdown of the data, reading from top to bottom (highest percentile to lowest):
* **90-100%:** Content Words: 31.0%, Function Words: ~69.0% (estimated)
* **80-90%:** Content Words: 30.8%, Function Words: ~69.2% (estimated)
* **70-80%:** Content Words: 30.7%, Function Words: ~69.3% (estimated)
* **60-70%:** Content Words: 30.8%, Function Words: ~69.2% (estimated)
* **50-60%:** Content Words: 31.1%, Function Words: ~68.9% (estimated)
* **40-50%:** Content Words: 32.2%, Function Words: ~67.8% (estimated)
* **30-40%:** Content Words: 34.1%, Function Words: ~65.9% (estimated)
* **20-30%:** Content Words: 36.9%, Function Words: ~63.1% (estimated)
* **10-20%:** Content Words: 40.3%, Function Words: ~59.7% (estimated)
* **Top 10%:** Content Words: 45.4%, Function Words: ~54.6% (estimated)
The content word ratio generally increases as we move down the percentile ranges (from 90-100% to Top 10%). The function word ratio correspondingly decreases.
### Key Observations
* The ratio of content words is lowest in the 90-100% percentile range and highest in the Top 10% percentile range.
* The difference in ratio between the highest and lowest percentile ranges is approximately 14.4% (45.4% - 31.0%).
* The function word ratio is consistently higher than the content word ratio across all percentile ranges.
* The increase in content word ratio is not perfectly linear, with some ranges showing smaller increases than others.
### Interpretation
This chart suggests that R1-Llama, as evaluated by AIME24, tends to use a higher proportion of function words compared to content words, especially when considering less frequent words. However, as the word frequency increases (moving towards the Top 10%), the proportion of content words increases significantly. This could indicate that the model relies more on common, content-bearing words when generating more frequent text. The consistent dominance of function words suggests the model is proficient in grammatical structure and coherence, even when using less frequent vocabulary. The relatively small differences in ratios between adjacent percentile ranges suggest a gradual shift in word usage rather than abrupt changes. This data could be used to fine-tune the model to achieve a desired balance between content and function word usage, potentially improving the clarity or creativity of the generated text.