## Bar Chart: R1-Llama | AIME24
### Overview
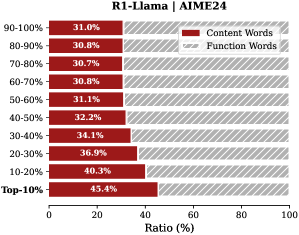
The chart displays the distribution of **Content Words** (red) and **Function Words** (gray) across 10 percentile categories, ranging from "90-100%" to "Top-10%". Each category represents a percentage range of tokens or words, with the x-axis showing their proportional contribution as a ratio (%).
### Components/Axes
- **Y-Axis (Categories)**:
- 90-100%
- 80-90%
- 70-80%
- 60-70%
- 50-60%
- 40-50%
- 30-40%
- 20-30%
- 10-20%
- Top-10%
- **X-Axis (Ratio %)**: 0 to 100%.
- **Legend**:
- Red = Content Words
- Gray = Function Words
- **Title**: "R1-Llama | AIME24" (top-center).
### Detailed Analysis
- **Content Words (Red)**:
- 90-100%: 31.0%
- 80-90%: 30.8%
- 70-80%: 30.7%
- 60-70%: 30.8%
- 50-60%: 31.1%
- 40-50%: 32.2%
- 30-40%: 34.1%
- 20-30%: 36.9%
- 10-20%: 40.3%
- Top-10%: 45.4%
- **Function Words (Gray)**:
- Calculated as 100% minus Content Words for each category (e.g., 90-100%: 69.0%, 80-90%: 69.2%, etc.).
### Key Observations
1. **Content Words** increase monotonically from 31.0% (90-100%) to 45.4% (Top-10%), indicating a higher concentration in lower percentile ranges.
2. **Function Words** dominate in higher percentile ranges (e.g., 69.0% in 90-100%) and decrease as the category percentage drops.
3. The largest gap between Content and Function Words occurs in the 90-100% category (31.0% vs. 69.0%).
### Interpretation
The data suggests that **Content Words** are more prevalent in the "Top-10%" category, while **Function Words** dominate in higher percentile ranges (e.g., 90-100%). This could imply that:
- **Content Words** are more concentrated in selective or high-quality segments (e.g., critical tokens for model performance).
- **Function Words** (e.g., prepositions, articles) are more common in bulk data, aligning with their role as structural elements in language.
- The trend may reflect a trade-off between meaningful content and syntactic structure in text analysis, relevant for tasks like model interpretability or NLP optimization.