## Bar Chart: Performance Comparison of Approaches
### Overview
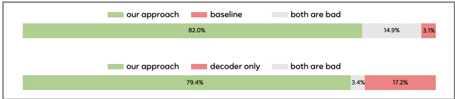
The image is a horizontal bar chart comparing the performance of two approaches ("our approach" and "baseline"/"decoder only") across two scenarios. Each scenario includes three categories: "our approach," "baseline/decoder only," and "both are bad." The chart uses color-coded bars to represent percentages, with a legend on the left.
### Components/Axes
- **Legend**:
- Green: "our approach"
- Red: "baseline" (top section) / "decoder only" (bottom section)
- Gray: "both are bad"
- **X-axis**: Labeled "Approach" (categories: "our approach," "baseline," "both are bad" for the top section; "our approach," "decoder only," "both are bad" for the bottom section).
- **Y-axis**: Labeled "Percentage (%)" (values range from 0% to 100%).
### Detailed Analysis
#### Top Section (Baseline Comparison)
- **Our approach**: 82.0% (green bar, longest)
- **Baseline**: 14.9% (red bar, medium length)
- **Both are bad**: 3.1% (gray bar, shortest)
#### Bottom Section (Decoder-Only Comparison)
- **Our approach**: 79.4% (green bar, longest)
- **Decoder only**: 17.2% (red bar, medium length)
- **Both are bad**: 3.4% (gray bar, shortest)
### Key Observations
1. **"Our approach" dominates** in both sections, with 82.0% in the top section and 79.4% in the bottom section.
2. **"Baseline" (top) and "decoder only" (bottom)** show lower performance, with "decoder only" slightly outperforming "baseline" (17.2% vs. 14.9%).
3. **"Both are bad"** categories are minimal in both sections (3.1% and 3.4%), indicating rare instances of poor performance.
### Interpretation
The data suggests that "our approach" consistently outperforms both the baseline and decoder-only methods. The slight decrease in "our approach" from 82.0% to 79.4% in the bottom section may reflect a minor trade-off in a different context (e.g., a more complex task or dataset). The "decoder only" method shows a modest improvement over the baseline, but it remains significantly less effective than "our approach." The near-identical "both are bad" percentages across sections imply that the approaches are generally reliable, with minimal failure rates. This highlights the superiority of "our approach" in the evaluated scenarios.