\n
## Chart: Performance Comparison of Approaches
### Overview
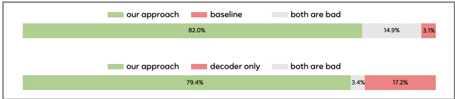
The image presents a horizontal bar chart comparing the performance of "our approach" against two baseline models: "baseline" and "decoder only". Performance is represented as percentages. The chart consists of two rows, each representing a different comparison scenario.
### Components/Axes
* **Horizontal Bars:** Represent the percentage of performance for each approach.
* **Legend:** Located at the top-left and bottom-left corners of the chart, defining the color-coding for each approach:
* Green: "our approach"
* Red: "baseline" (top row) / "decoder only" (bottom row)
* Light Gray: "both are bad"
* **Percentage Labels:** Displayed directly on each bar segment, indicating the percentage value.
* **No explicit axes titles** are present, but the chart implicitly compares performance percentages.
### Detailed Analysis
**Row 1: "our approach" vs. "baseline" vs. "both are bad"**
* The green bar representing "our approach" extends approximately 82% across the horizontal axis.
* The red bar representing "baseline" starts at approximately 82% and extends to 96% (82% + 14%).
* The light gray bar representing "both are bad" starts at 96% and extends to 99% (96% + 3%).
* Specific values:
* "our approach": 82%
* "baseline": 14%
* "both are bad": 3%
**Row 2: "our approach" vs. "decoder only" vs. "both are bad"**
* The green bar representing "our approach" extends approximately 79.4% across the horizontal axis.
* The red bar representing "decoder only" starts at approximately 79.4% and extends to 96.6% (79.4% + 17.2%).
* The light gray bar representing "both are bad" starts at 96.6% and extends to 99% (96.6% + 3.4%).
* Specific values:
* "our approach": 79.4%
* "decoder only": 17.2%
* "both are bad": 3.4%
### Key Observations
* "Our approach" consistently outperforms both baseline models in both comparison scenarios.
* The "decoder only" model performs significantly worse than the "baseline" model.
* The "both are bad" category represents a small percentage of cases in both scenarios.
* The performance of "our approach" is slightly higher when compared to the "baseline" model (82%) than when compared to the "decoder only" model (79.4%).
### Interpretation
The data suggests that "our approach" is a superior method compared to both the "baseline" and "decoder only" models. The substantial difference in performance between "our approach" and the "decoder only" model indicates that the decoder-only approach is significantly less effective. The small percentage associated with "both are bad" suggests that the majority of cases are handled reasonably well by at least one of the approaches. The slight decrease in "our approach" performance when compared to the "decoder only" model could be due to the specific characteristics of the "decoder only" model, or the dataset used for evaluation. Further investigation would be needed to understand the reasons for this difference. The chart provides a clear visual representation of the relative strengths of each approach, making it easy to compare their performance.