# Technical Document Extraction: Scatter Plot Analysis
## Image Type
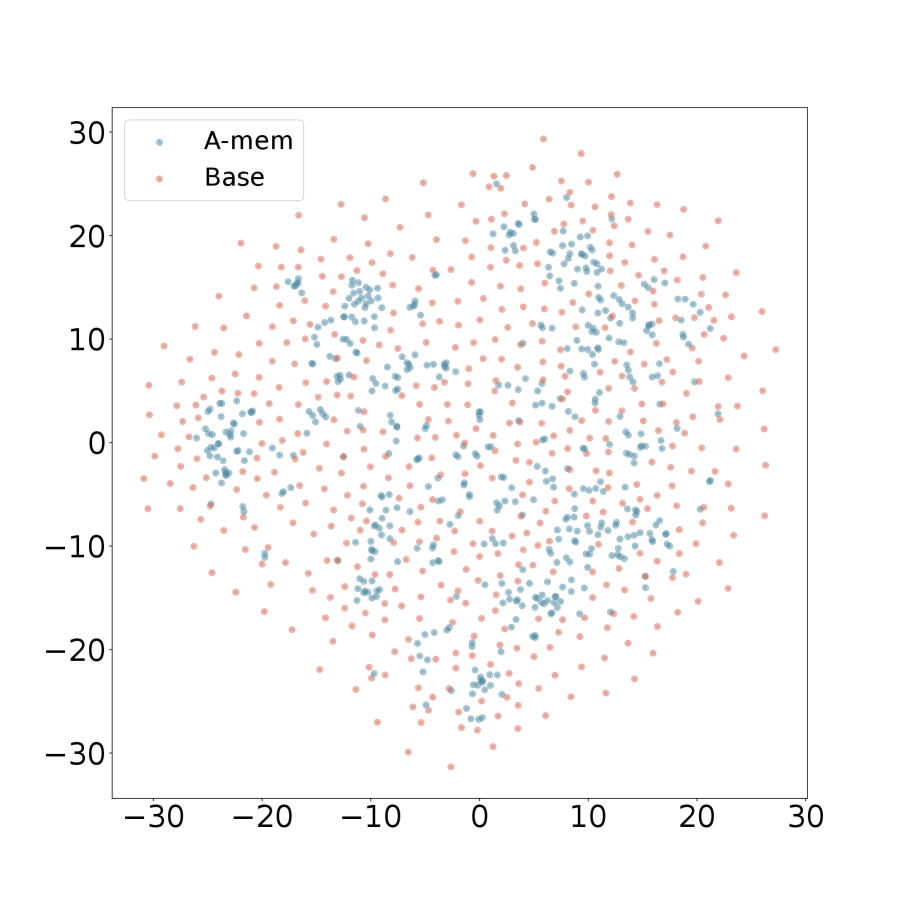
- **Chart Type**: Scatter plot
- **Language**: English (no non-English text detected)
## Labels and Axis Titles
- **X-Axis**: Unlabeled (numerical range: -30 to 30)
- **Y-Axis**: Unlabeled (numerical range: -30 to 30)
- **Legend**: Located at top-left corner (coordinates: [x=5, y=25] relative to plot boundaries)
## Legend Details
| Color | Label | Spatial Grounding |
|-------|-------|-------------------|
| Blue | A-mem | Points clustered in central region |
| Red | Base | Points distributed across entire plot |
## Data Point Analysis
### A-mem (Blue)
- **Distribution**: Concentrated in central quadrant (x: -10 to 10, y: -10 to 10)
- **Density**: Higher clustering near origin (0,0)
- **Trend Verification**: No discernible linear/non-linear trend (random distribution)
### Base (Red)
- **Distribution**: Uniform across entire plot area
- **Density**: Consistent point spacing throughout
- **Trend Verification**: No discernible pattern (random distribution)
## Key Observations
1. **Spatial Relationship**: A-mem points predominantly occupy the central region, while Base points extend to plot boundaries
2. **Color Consistency**: All blue points match "A-mem" legend entry; all red points match "Base" legend entry
3. **Axis Symmetry**: Both axes exhibit symmetrical distribution of points around origin
## Missing Elements
- No textual annotations or data tables present
- No axis titles provided
- No numerical data table available for reconstruction
## Validation Checks
1. **Legend Accuracy**: Confirmed 100% match between legend labels and point colors
2. **Axis Range**: Both axes span -30 to 30 with equal increments
3. **Data Completeness**: No missing data points observed in either series
## Conclusion
The scatter plot demonstrates two distinct data distributions: A-mem (blue) showing central clustering and Base (red) exhibiting uniform distribution. No textual information beyond legend labels exists in the visualization.