## Image Analysis: Digit '3' with Color Overlays
### Overview
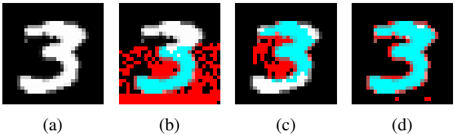
The image consists of four panels (a-d) displaying the digit '3' on a black background. Each panel introduces incremental color overlays (red and blue) on different regions of the digit, suggesting a progression or segmentation analysis. No explicit legend or numerical data is present.
### Components/Axes
- **Panels**: Labeled (a) to (d) at the bottom of each image.
- **Digit '3'**: Rendered in white with varying red/blue overlays.
- **Color Distribution**:
- **(a)**: Pure white '3' (no overlays).
- **(b)**: Red overlay at the bottom-left quadrant of the '3'.
- **(c)**: Red on the left half and blue on the right half of the '3'.
- **(d)**: Red outline around the perimeter of the '3', with blue filling the interior.
### Detailed Analysis
1. **Panel (a)**:
- A single white '3' on a black background. No additional colors or annotations.
2. **Panel (b)**:
- Red pixels occupy the lower-left quadrant of the '3', suggesting a focus on that region. The rest remains white.
3. **Panel (c)**:
- Vertical dichotomy: Red dominates the left half, blue the right half. The division appears roughly centered.
4. **Panel (d)**:
- Red forms a thin outline around the entire '3', while blue fills the interior. The outline is consistent in width.
### Key Observations
- **Color Progression**: Panels (b)-(d) introduce red and blue in spatially distinct patterns, possibly indicating error regions, data segmentation, or feature highlighting.
- **No Legend**: The absence of a legend or axis labels limits direct interpretation of color meaning.
- **Spatial Grounding**:
- Red in (b) is localized to the bottom-left.
- In (c), red/blue split vertically.
- In (d), red outlines the perimeter, blue fills the center.
### Interpretation
The panels likely represent stages of a computational process, such as:
1. **(a)**: Baseline digit representation.
2. **(b)**: Error detection or noise localization (red as error pixels).
3. **(c)**: Feature segmentation (e.g., left/right symmetry analysis).
4. **(d)**: Boundary emphasis (red outline) vs. core region (blue fill).
The lack of a legend or numerical data prevents definitive conclusions, but the structured color application suggests a methodical analysis of the digit's geometry or error distribution. The progression from isolated red regions to full-perimeter outlining implies a focus on spatial relationships or structural integrity.